CODAP › Forums › CODAP Help Forum › Embedding CODAP components (table or Graph) in webpage
Tagged: HTML; webpage embed
- This topic has 4 replies, 3 voices, and was last updated 6 years, 7 months ago by
Kathy Shafer.
-
AuthorPosts
-
Hollylynne Lee
ParticipantI am looking to build some interactive webpages like those illustrated here: How do I do this? Directions would be helpful for how to grab and embed code from different components in a CODAP file and integrate them onto a different page.
September 13, 2017 at 3:11 am #403Bill Finzer
KeymasterOK, so we’re assuming you can create a webpage. Here are the steps:
- Create the CODAP document just how you want it, with everything laid out starting at the top left. Give this document a name and save it.
- In the 3-strips menu choose Share… / Get link to shared view. This will open a dialog box.
- Press the Enable Sharing button. This will bring up a Share dialog box.
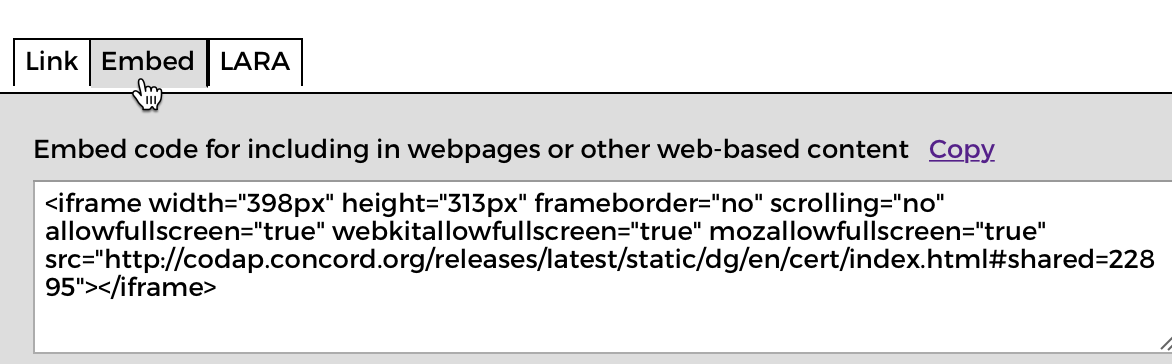
- Choose the middle tab Embed.
- Copy the code in the box (the text that starts with “<iframe”).
- Go into your web page editor where you want to embed the CODAP document.
- Paste the code you copied in the desired place.
- Edit the code by inserting “?componentMode=yes” in the place shown here:
src="http://codap.concord.org/app/<strong>?componentMode=yes</strong>#shared=12345">- Open your web page and figure out what width and height of the rectangle you want and edit those two numbers in the code.
Notice that CODAP’s tool shelf is not showing. That’s because you added the code that turns on “componentMode.”
Be aware that you can at any time go back to your original saved document, make changes, save them, and use Share… / Update shared view so that the next time your web page is viewed, your changes are there.
Hoping this works,
Bill-
This reply was modified 6 years, 7 months ago by
Bill Finzer. Reason: Add info about updating shared view
Attachments:
September 14, 2017 at 4:49 pm #417Kathy Shafer
ParticipantHollyLynne & Bill,
Hi. I had this question as well. Here are some examples of what Bill explained above. Hopefully they make sense.
https://tinkerplots-math.wikispaces.com/Practice+Page
Bill, how do we limit the number of measurement tools? I noticed in the numbers plot on the right you allowed only five.
Kathy
September 14, 2017 at 5:26 pm #418KeymasterHi Kathy,
Bill, how do we limit the number of measurement tools? I noticed in the numbers plot on the right you allowed only five.
Do you mean how many “checkboxes” show in the Ruler menu. I’m not doing anything special and currently there is no way for you as the author to control what shows up there.
Bill
September 14, 2017 at 6:31 pm #419ParticipantYes, that was my question. Thanks for your response!
Maybe that particular plot was created before the rest of the tools were created. I am curious about that plot.
I anticipate wanting to restrict a few of these options in the Ruler menu for an introductory level activity.
-
This reply was modified 6 years, 7 months ago by
-
AuthorPosts
- You must be logged in to reply to this topic.