CODAP › Forums › CODAP Help Forum › Understanding structure for time series
- This topic has 4 replies, 4 voices, and was last updated 5 years, 10 months ago by
Andee Rubin.
-
AuthorPosts
-
R.Meggie B.Harvey
ParticipantHi,
We are working with rates of lyme disease for each state, from 2006 to 2016. What makes the most intuitive sense to us is that the state is the case (row) and the attributes are the rates in a given year (columns). If we bring the dataset into CODAP like that, we can not get a graph of the time series for a state. Instead, we have to bring it in with the years as the case (row), and the rates in a state as the attribute (column). Then we can graph time series for a given state.
We are hoping that the CODAP community and developers can either help us understand how to get a time series with state as the case, or can help us understand the rationale for why this doesn’t work.
Here is a link to our dataset: https://codap.concord.org/app/#shared=43771
Thank you!
-
This topic was modified 5 years, 10 months ago by
R.Meggie B.Harvey.
June 19, 2018 at 7:20 pm #574Bill Finzer
KeymasterHello,
There’s a nice solution to this. Go to CODAP Data Interactives and scroll down to the Attribute Stacker.
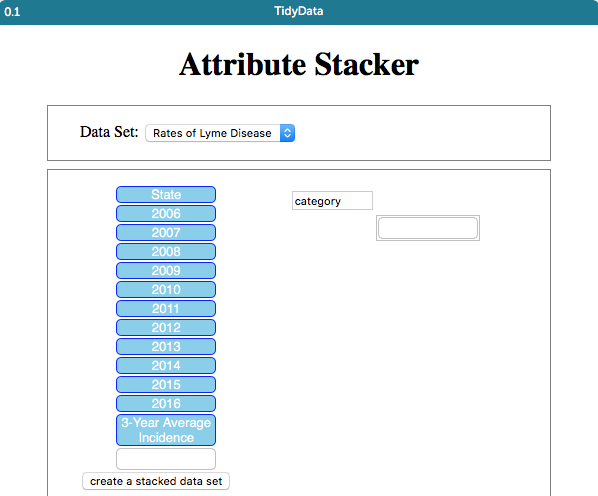
- Set things up so you can drag the “Embeddable Link” for the Attribute Stacker into your CODAP document. Having done so, the stacker will look like the first screen capture.
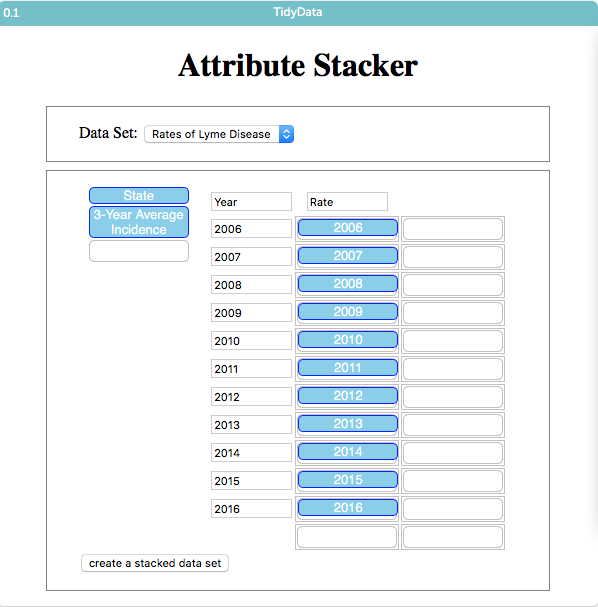
- In the stacker, drag each of the year attributes into a slot on the right so that it looks like the second screen capture. Also, provide Year for a category name and Rate for a value name.
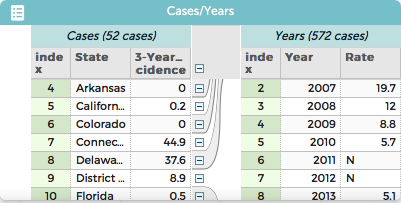
- Press the Create a stacked data set button. This will give you a data set like the one in the third screen shot.
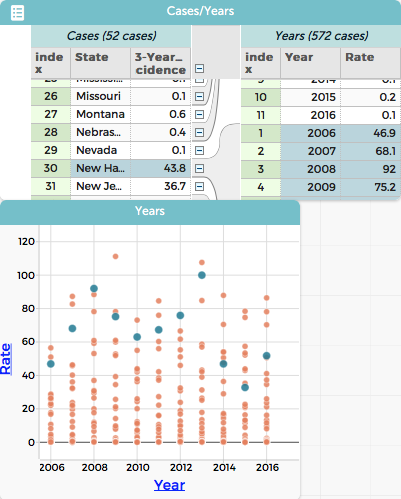
Notice that some of the values under Rate are not numbers. You may want to edit those values to be blanks so that making the graph shown in the final screen shot will be easier to make.
Notice that selecting a case at the state level selects all the points representing rates in the graph.
Thanks for the question. And I hope this helps.
Bill
Attachments:
June 19, 2018 at 7:26 pm #579KeymasterHello again,
I neglected to address the rationale. Thinking about the situation, there are two kinds of “cases”: states, and rates. Each state has a rate for each year, and each rate for a given year belongs to a certain state. This implies a hierarchy. Row by column structures are far from ideal for modeling hierarchies. CODAP allows you to create any number of levels, and this works very well for a surprising number of situations.
Bill
June 19, 2018 at 7:31 pm #580Jonathan Sandoe
KeymasterSomething like this: https://codap.concord.org/app/#shared=44494 ?
It groups the years as subgroups of states. I made it using the Attribute Stacker plugin: https://concord-consortium.github.io/codap-data-interactives//AttributeStacker/index.html .
Regards,
Jonathan
June 20, 2018 at 9:57 pm #591I wanted to add an observation to this thread. A central part of the issue is that there are really THREE variables here: year, state and rate – notice that in any of your data tables in the original dataset, any row has a mixture of values. In one table, both the state name and the rates are in a row (and the years are the columns); in another table, both the year and the rates are in a row (and the states are the columns). There’s something about the structure of the dataset that requires a something other than a flat structure. The attribute stacker fixes the problem, but it would help to have a more semantic description of the problem that it fixes and the way it does so. We wouldn’t necessarily share this reasoning with the middle school kids, but it’s very helpful for the staff of Data Clubs (and maybe also for CODAP folks).
-
This topic was modified 5 years, 10 months ago by
-
AuthorPosts
- You must be logged in to reply to this topic.