Select Data in a Graph
When you select cases in a case table or graph, those cases appear as selected everywhere they are visible (i.e., the selected cases will be highlighted in all tables, graphs, and/or maps that are open in CODAP). This provides a simple but powerful technique for exploring your data.
- To select one dot, click it.

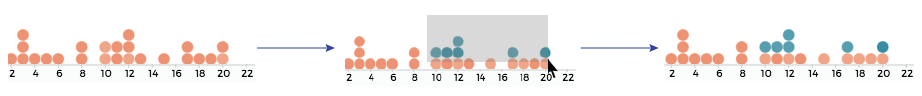
- To select multiple dots, draw a selection rectangle around them. To draw the rectangle, press down and hold the button on your mouse and drag the cursor across the points you want to select. All cases partially within the rectangle will be selected. You can also select multiple cases by holding down the shift key and clicking on each case individually.
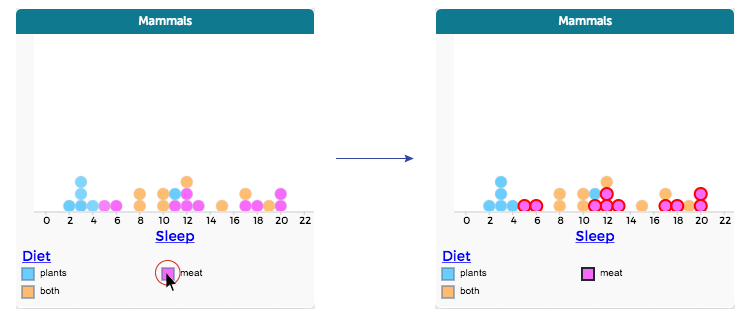
- To select all cases in a category, click the legend symbol for that category.
- To unselect the previously selected cases on the graph, click on a blank space in the center of the graph.
It is also possible to select data in a table (see instructions here).
Was this Article Useful?
Add new comment
Comments are closed for the CODAP Help site. If you have a question or problem, please post on the CODAP Help Forum instead. Thank you.