Difference in graph when variable is numeric or categorical

CODAP Forums CODAP Help Forum Difference in graph when variable is numeric or categorical

Viewing 3 posts - 1 through 3 (of 3 total)
  • Author
    Posts
  • #1458 Score: 0
    Andee Rubin
    Participant
    4 pts

    I have attached two versions of a graph.  The variable on the  Y-axis is a numerical variable, the same in both graphs.  The variable on the X-axis is the same, but it has been treated as a numerical variable in one case and a categorical variable in the second case.  Why do the graphs look so different?  I would have thought that the distributions above each number/category would be the same, regardless of whether the X-axis is categorical or numerical.

    #1461
    Bill Finzer
    Keymaster

    Hi Andee,

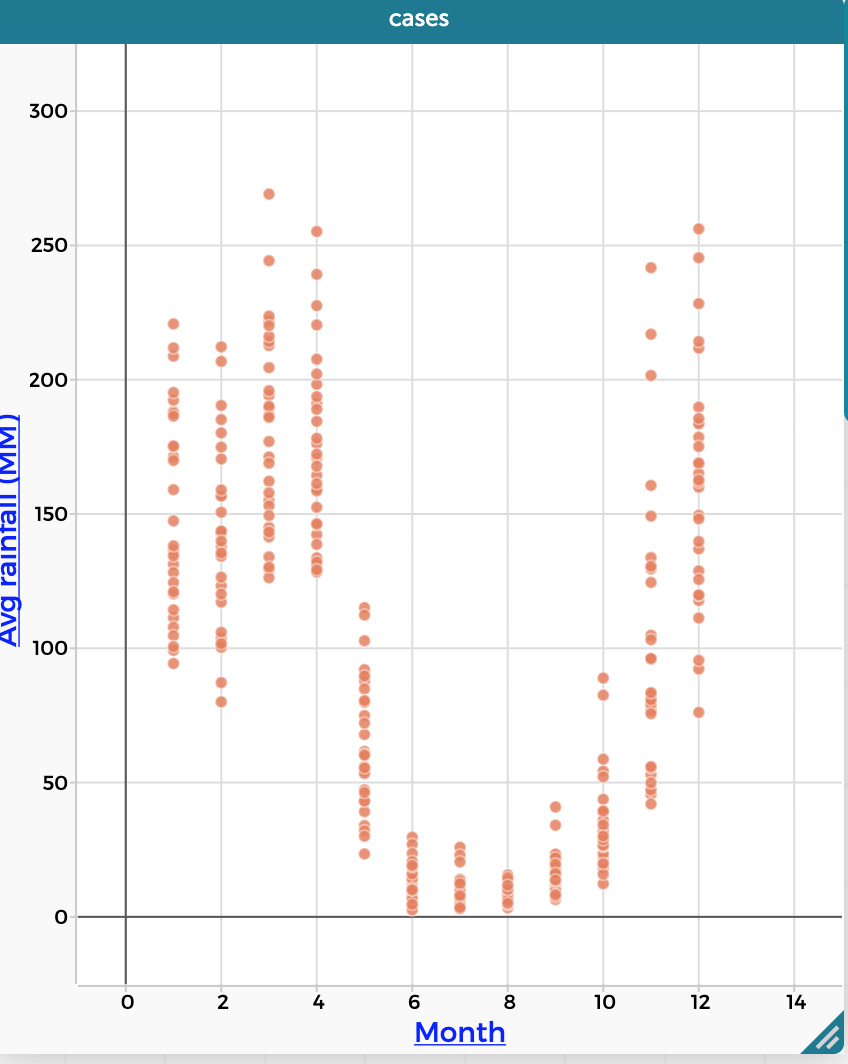
    When the x-axis is numeric, the x-coordinate of the plotted point will be exactly its value above the axis. So if month is 4, the point will lie above the 4. If two points have the same value for month they may overlap if their y-values are close.

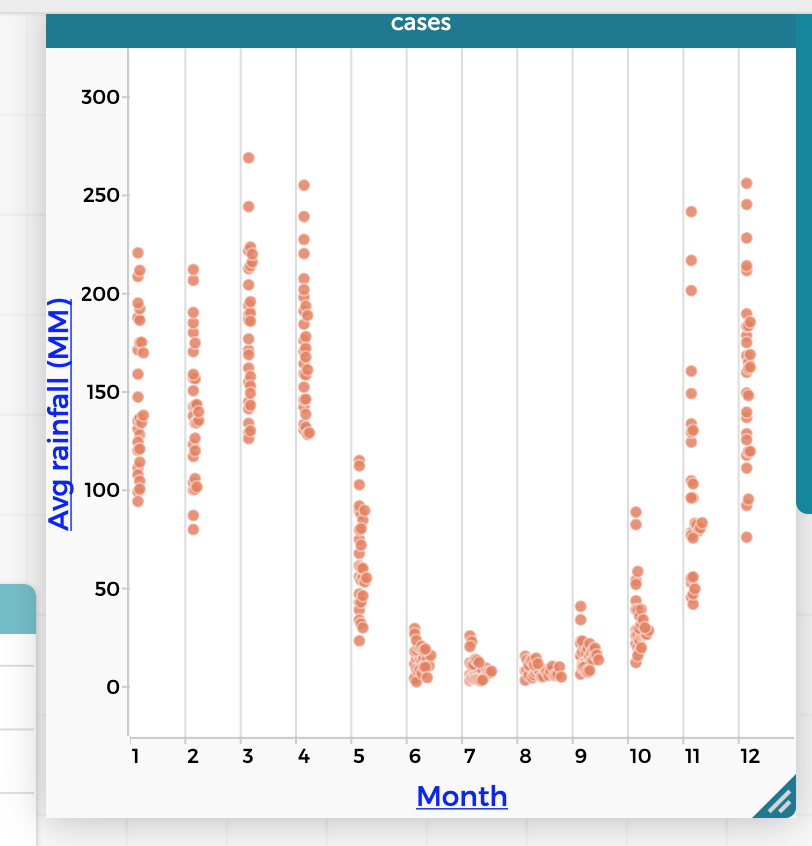
    When the x-axis is categorical, each category gets a bit of space for its points and the points get stacked (horizontally in this case) as needed within that space. So two points with the same month and rainfall will be offset from each other horizontally.

    I hope that explains the difference!

    Bill

    #1462
    Andee Rubin
    Participant
    4 pts

    Yes, I get it and it makes sense!  Really confused me at first though!  Thanks.

Viewing 3 posts - 1 through 3 (of 3 total)
  • You must be logged in to reply to this topic.