CODAP › Forums › CODAP Help Forum › Multiple attributes on Y axis with categorical X axis
Tagged: multiple y attributes
- This topic has 9 replies, 5 voices, and was last updated 1 month, 1 week ago by
Bill Finzer.
-
AuthorPosts
-
I love the ability to have multiple Y attributes – either on a single axis or two different axes. However, CODAP doesn’t seem to allow this when the X-axis is categorical. Is there a reason for that? In the attached dataset, I want to plot both buffalo and wildebeest populations against month in the same graph.
<span style=”color: #000000; font-family: Montserrat, sans-serif; font-size: 12px; white-space: pre; background-color: #eeeeee;”>https://codap.concord.org/app/static/dg/en/cert/index.html#shared=https%3A%2F%2Fcfm-shared.concord.org%2FBzkCSnGcKP7V6o9PFDz5%2Ffile.json</span>
April 5, 2021 at 10:37 pm #6371Bill Finzer
KeymasterHi Andee,
CODAP supports multiple y-axis attributes for scatterplots because it is such a common use case. While I’m sure there a many situations like the one you put forward where it would be useful they just don’t come up among our audience. (You’re the first.)
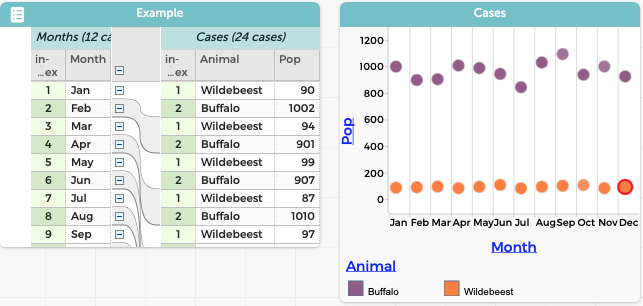
Incidentally, I couldn’t resist creating this (unsatisfactory) workaround by superimposing two graphs, the top one with a transparent background.
Bill
April 5, 2021 at 11:15 pm #6372Perhaps you can help me figure out the best way to handle the situation I’m in if you don’t think this feature would be implemented…
April 6, 2021 at 2:59 pm #6376KeymasterThe screenshot shows how to structure data so that you can get more than one “set” of values on the y-axis with a categorical attribute on the x-axis.
Here is a link to that example document.
Hope this helps,
Bill
Attachments:
June 30, 2021 at 6:47 pm #6547ashish.amresh@gmail.com
ParticipantI am also requesting the feature to have two or numeric attributes on the Y axis when there is a categorical attribute on X. In out case we have many cities on the X and each has numeric values for indoor and outdoor water quality variables (e.g ph) and it would be good to compare all of these on the same Y
June 30, 2021 at 7:07 pm #6548KeymasterHello Ashish,
Thanks for adding your request for this feature. It really helps us prioritize.
A question: Did you consider modifying the data structure as in my April 6 post? If you did so and rejected the idea, can you say a bit about what got in your way?
Thanks,
Bill
July 14, 2021 at 2:59 am #6563rgaston5@yahoo.com
ParticipantHi Bill,
My son Matt’s use case is having a number of character types in D&D, and each character has a number of different attributes that have numeric values.
So he has the various character types on the x, and wanted to add multiple attributes onto the y that could be compared for each attribute. Then questions could be answered like “Which character has the greatest strength? Durability?” etc.
We looked at your restructuring of the data table in your April 6 post, and that actually seems like a good workaround! But ultimately having only points that are representing the data, rather than bars, and the points being potentially overlapping, may mean this isn’t the best tool for making the comparisons he’s trying to do.
I hope the project is going well Bill, glad to see you all are still very active.
Best,
Rick
July 14, 2021 at 3:01 pm #6565KeymasterHi Rick,
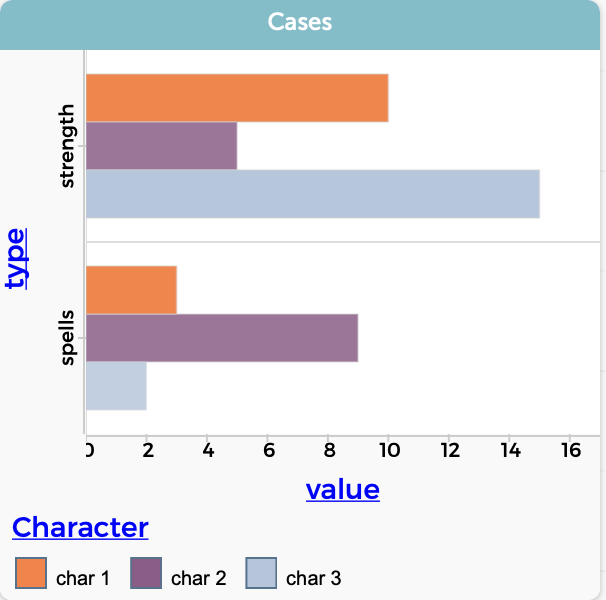
I wonder if the graph screen capture is what you and Matt have been hoping for?
Bill
Attachments:
March 13, 2024 at 4:53 pm #8291rachel@bootstrapworld.org
ParticipantHello!
I see that this thread is quite old, but am hoping to continue the conversation a bit. Basically, I would love to know how you created the multi bar chart that is in the screenshot you posted on 7/14/21!
When I drag an attribute to the y or x axis and then drag another attribute to the middle of the display, I get a stacked bar chart. Curious how to convert into a multi bar display.
Thanks!
RachelMarch 13, 2024 at 5:35 pm #8292KeymasterHello,
Yes, it’s been awhile! But I reconstructed the CODAP document here so you can play with it.
The critical move is, once you have the three attributes in place, to go to the graph’s Configuration menu (looks like a histogram) and choose Bar for Each Point.
Hope this helps,
Bill
-
AuthorPosts
- You must be logged in to reply to this topic.