Multiple dotplots in a single graphing window

CODAP Forums CODAP Help Forum Multiple dotplots in a single graphing window

Tagged: 

Viewing 2 posts - 1 through 2 (of 2 total)
  • Author
    Posts
  • #6913 Score: 0
    dharvey@dalton.org
    Participant

    Good morning,

    Is there any way to graph multiple dotplots in a single graphing window? (What I am referring to was achieved in Fathom by dropping an attribute on the + symbol in the bottom left of the graphing window along the x-axis.)

    Thank you,
    David

    #6914
    Bill Finzer
    Keymaster

    Hi David,

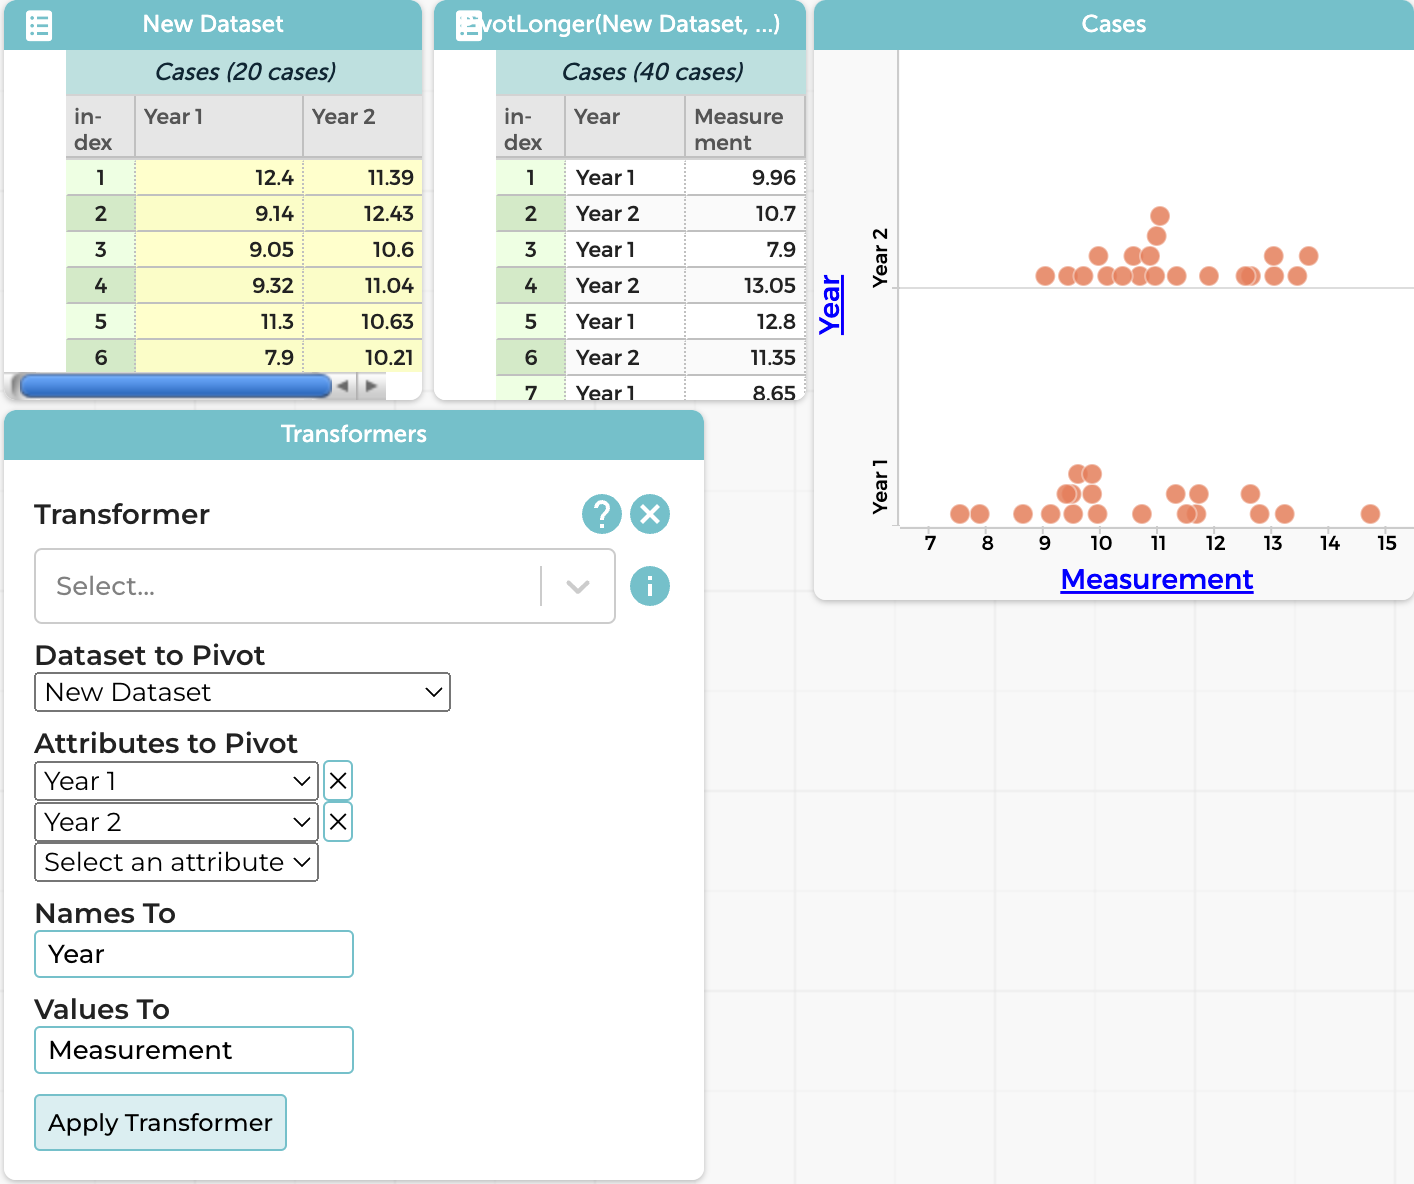
    No, sorry, we haven’t provided that capability in CODAP. However, in many situations, the desired plot can be created through a transformation of the data. The screenshot I’ve attached shows the basic idea. The values of the two attributes in the dataset at left are what you want to plot on the same graph. Using the Pivot Longer transform from the builtin plugin Transformers, you create two new attributes, one for year and another for the values. Now you can make the graph!

    Hope this helps,

    Bill

    • This reply was modified 2 years, 1 month ago by Bill Finzer.
    • This reply was modified 2 years, 1 month ago by Bill Finzer.
    Attachments:
Viewing 2 posts - 1 through 2 (of 2 total)
  • You must be logged in to reply to this topic.