Plot a Numeric Value as a Bar
Sometimes it's useful to be able to plot numeric values as bars instead of points. This graph of BodyLength of individual cats, for example, might look better if each body length were a horizontal bar.
1. Click the graph so that the inspector palette appears to the right of it: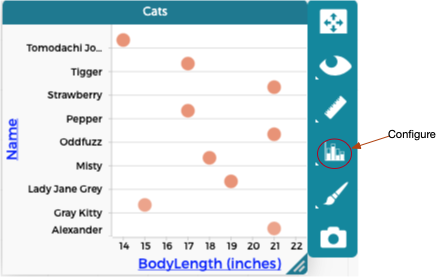
2. Click the Configuration icon so that the configuration menu appears: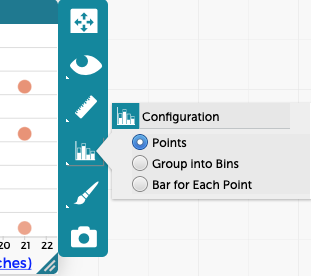
3. There are three options in the Configuration menu. Select Bar for Each Point.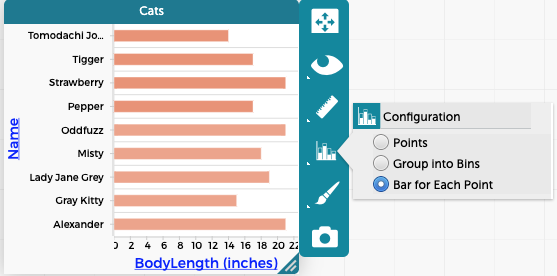
Now each cat's body length is represented as a bar. Longer bars means longer cats!
Note that it is also possible to fuse dots for a categorical attribute into bars, as described here.
Was this Article Useful?