December 14, 2024 at 9:34 pm
#10908
Keymaster
Some of your issues are caused by the fact that you have multiple tables with boundaries and lat/longs, not just the one being shown on the canvas. If you click on the tables button in the toolbar and delete the other datasets, then the map will behave better. You have also found one of our bugs. If you have both boundaries and lat/long points in a dataset, then you must drop the attribute to color the boundaries first, and then the attribute to color the lat/long points. This is a bug on our side and we do plan to fix this. However, I don’t have a specific timeline for you on this.
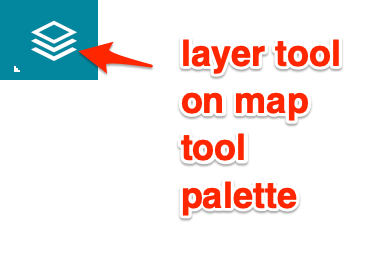
Note, you can customize the colors by clicking on the layers tool in the map tool palette.