- This topic has 4 replies, 2 voices, and was last updated 7 years, 10 months ago by
Cristián Rizzi Iribarren.
-
AuthorPosts
-
Cristián Rizzi Iribarren
ParticipantHi,
I would like to fully understand the logic behind parent-child graphs and tables.
In my air-quality file I would like to know the mean of a pollutant concentration per month and per hour.
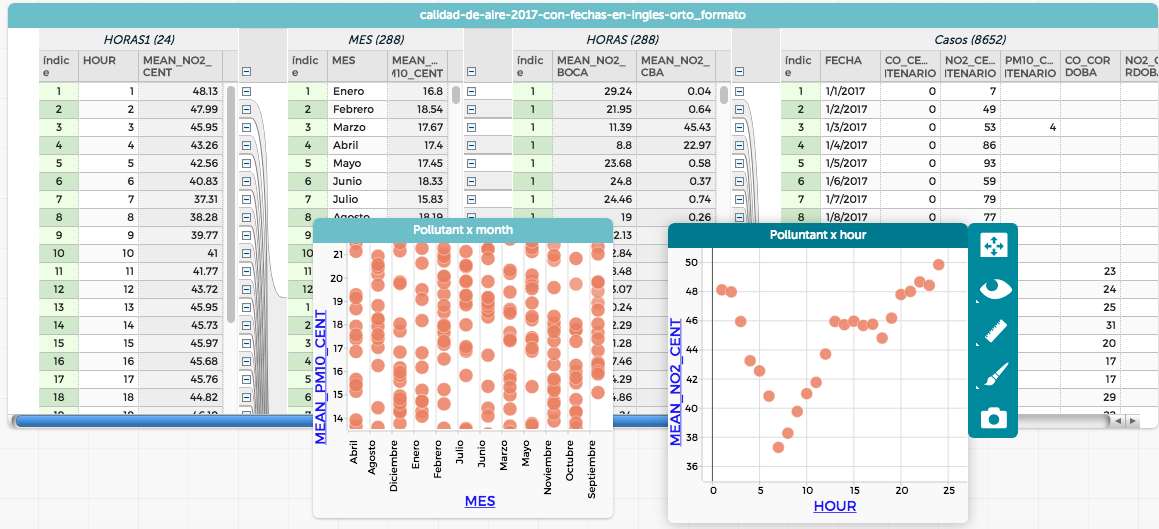
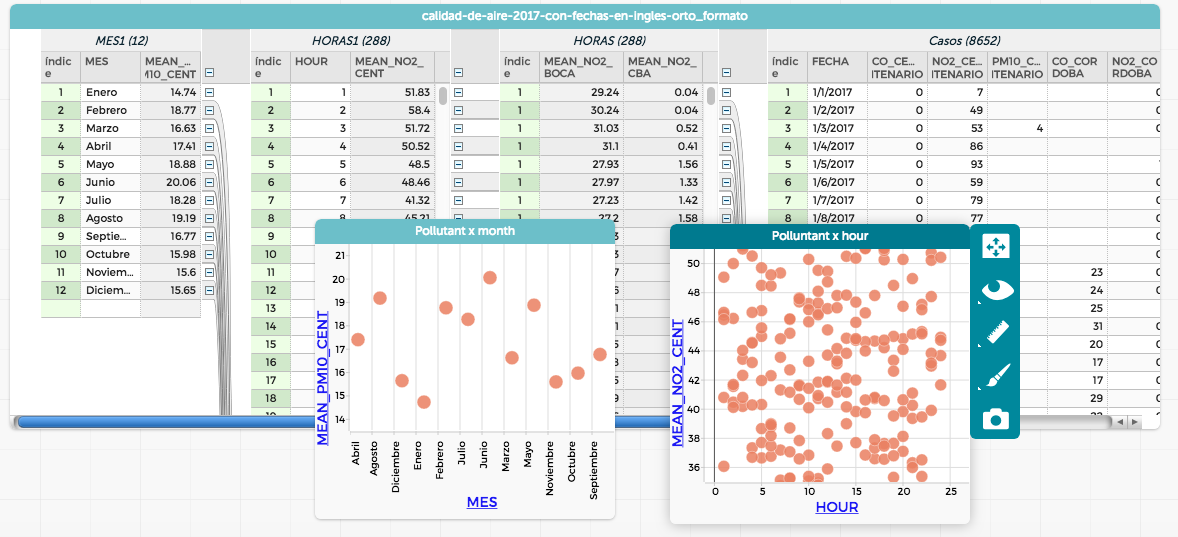
If I place “Hours” as the left-most column of the table (“parent?”) the “Pollutant x Hour” graph displays properly but the “Pollutant x Month” shows a lot of cases, and viceversa: if I place “Months” as the left-most column, the “Pollutant x Month” displays properly but the “Pollutant x Hour” doesn’t.
Is there a way to arrange data so both graphs display properly?
Here are both screenshots, each one with a different arrangement:
You can click here to access the file.
Thanks a lot.
Cristián
April 2, 2018 at 2:43 pm #500 Bill FinzerKeymaster
Good question! As you’ve discovered, each organization of the data results in a different number of points in the two graphs. And only one organization at a time is possible. So, it is not possible to produce both a graph with 12 month points and a graph with 24 hour points at the same time.
A workaround which you may already have discovered is to click on the graph’s camera icon and open the image in the draw tool where it will be displayed statically, not changing when you restructure the data. (Of course you forgo dynamic selection for the static image.)
Bill
April 2, 2018 at 3:32 pm #504ParticipantHi Bill, thanks for your help. Now it’s clear for me that both organizations are possible just one at a time. And good trick to open a new window showing the graph as a picture!!
Going one more step beyond the issue, I would like to understand -conceptually- when it’s necessary to create a parent table.
Thanks again.
Regards,
Cristián
April 2, 2018 at 5:52 pm #506Bill FinzerKeymasterHi Cristián,
This is a really interesting discussion topic. In fact, in a Data Science Games project meeting today we were grappling with exactly this issue. Tim Erickson is drafting a discussion paper about it and has agreed that others are welcome to read it here.
Let us know what you think and in particular whether it it helps you with the conceptual question of when one needs to create a parent table.
Bill
April 2, 2018 at 5:59 pm #509ParticipantThanks a lot Bill!! This is great. I was affraid of being asking very basic/silly questions…
Glad to hear that this is a shared concern.
Kind regards,
Cristián
-
AuthorPosts
- You must be logged in to reply to this topic.