Forum Replies Created
-
AuthorPosts
-
 Andrew RossParticipant
Unfortunately, I can’t think of a way to do the analysis with the current data format.
I am guessing that another way to express the data is something like this:
<style type=”text/css”>td {border: 1px solid #cccccc;}br {mso-data-placement:same-cell;}</style>
<table dir=”ltr” style=”table-layout: fixed; font-size: 10pt; font-family: Arial; width: 0px; border-collapse: collapse; border: none;” border=”1″ cellspacing=”0″ cellpadding=”0″ data-sheets-root=”1″ data-sheets-baot=”1″><colgroup><col width=”100″ /><col width=”100″ /><col width=”100″ /><col width=”100″ /></colgroup>
<tbody>
<tr style=”height: 21px;”>
<td style=”overflow: hidden; padding: 2px 3px 2px 3px; vertical-align: bottom;”>ParticipantName</td>
<td style=”overflow: hidden; padding: 2px 3px 2px 3px; vertical-align: bottom;”>Activity</td>
<td style=”overflow: hidden; padding: 2px 3px 2px 3px; vertical-align: bottom;”>Duration</td>
<td style=”overflow: hidden; padding: 2px 3px 2px 3px; vertical-align: bottom;”>HowManyTimes</td>
</tr>
<tr style=”height: 21px;”>
<td style=”overflow: hidden; padding: 2px 3px 2px 3px; vertical-align: bottom;”>PersonA</td>
<td style=”overflow: hidden; padding: 2px 3px 2px 3px; vertical-align: bottom;”>signatures</td>
<td style=”overflow: hidden; padding: 2px 3px 2px 3px; vertical-align: bottom; text-align: right;”>10</td>
<td style=”overflow: hidden; padding: 2px 3px 2px 3px; vertical-align: bottom; text-align: right;”>2</td>
</tr>
<tr style=”height: 21px;”>
<td style=”overflow: hidden; padding: 2px 3px 2px 3px; vertical-align: bottom;”>PersonA</td>
<td style=”overflow: hidden; padding: 2px 3px 2px 3px; vertical-align: bottom;”>signatures</td>
<td style=”overflow: hidden; padding: 2px 3px 2px 3px; vertical-align: bottom; text-align: right;”>20</td>
<td style=”overflow: hidden; padding: 2px 3px 2px 3px; vertical-align: bottom; text-align: right;”>4</td>
</tr>
<tr style=”height: 21px;”>
<td style=”overflow: hidden; padding: 2px 3px 2px 3px; vertical-align: bottom;”>PersonA</td>
<td style=”overflow: hidden; padding: 2px 3px 2px 3px; vertical-align: bottom;”>signatures</td>
<td style=”overflow: hidden; padding: 2px 3px 2px 3px; vertical-align: bottom; text-align: right;”>30</td>
<td style=”overflow: hidden; padding: 2px 3px 2px 3px; vertical-align: bottom; text-align: right;”>6</td>
</tr>
<tr style=”height: 21px;”>
<td style=”overflow: hidden; padding: 2px 3px 2px 3px; vertical-align: bottom;”>PersonA</td>
<td style=”overflow: hidden; padding: 2px 3px 2px 3px; vertical-align: bottom;”>signatures</td>
<td style=”overflow: hidden; padding: 2px 3px 2px 3px; vertical-align: bottom; text-align: right;”>40</td>
<td style=”overflow: hidden; padding: 2px 3px 2px 3px; vertical-align: bottom; text-align: right;”>8</td>
</tr>
<tr style=”height: 21px;”>
<td style=”overflow: hidden; padding: 2px 3px 2px 3px; vertical-align: bottom;”>PersonA</td>
<td style=”overflow: hidden; padding: 2px 3px 2px 3px; vertical-align: bottom;”>signatures</td>
<td style=”overflow: hidden; padding: 2px 3px 2px 3px; vertical-align: bottom; text-align: right;”>50</td>
<td style=”overflow: hidden; padding: 2px 3px 2px 3px; vertical-align: bottom;”></td>
</tr>
<tr style=”height: 21px;”>
<td style=”overflow: hidden; padding: 2px 3px 2px 3px; vertical-align: bottom;”>PersonA</td>
<td style=”overflow: hidden; padding: 2px 3px 2px 3px; vertical-align: bottom;”>signatures</td>
<td style=”overflow: hidden; padding: 2px 3px 2px 3px; vertical-align: bottom; text-align: right;”>60</td>
<td style=”overflow: hidden; padding: 2px 3px 2px 3px; vertical-align: bottom; text-align: right;”>12</td>
</tr>
<tr style=”height: 21px;”>
<td style=”overflow: hidden; padding: 2px 3px 2px 3px; vertical-align: bottom;”>PersonB</td>
<td style=”overflow: hidden; padding: 2px 3px 2px 3px; vertical-align: bottom;”>typing</td>
<td style=”overflow: hidden; padding: 2px 3px 2px 3px; vertical-align: bottom; text-align: right;”>10</td>
<td style=”overflow: hidden; padding: 2px 3px 2px 3px; vertical-align: bottom; text-align: right;”>12</td>
</tr>
<tr style=”height: 21px;”>
<td style=”overflow: hidden; padding: 2px 3px 2px 3px; vertical-align: bottom;”>PersonB</td>
<td style=”overflow: hidden; padding: 2px 3px 2px 3px; vertical-align: bottom;”>typing</td>
<td style=”overflow: hidden; padding: 2px 3px 2px 3px; vertical-align: bottom; text-align: right;”>20</td>
<td style=”overflow: hidden; padding: 2px 3px 2px 3px; vertical-align: bottom; text-align: right;”>22</td>
</tr>
<tr style=”height: 21px;”>
<td style=”overflow: hidden; padding: 2px 3px 2px 3px; vertical-align: bottom;”>PersonB</td>
<td style=”overflow: hidden; padding: 2px 3px 2px 3px; vertical-align: bottom;”>typing</td>
<td style=”overflow: hidden; padding: 2px 3px 2px 3px; vertical-align: bottom; text-align: right;”>30</td>
<td style=”overflow: hidden; padding: 2px 3px 2px 3px; vertical-align: bottom; text-align: right;”>30</td>
</tr>
<tr style=”height: 21px;”>
<td style=”overflow: hidden; padding: 2px 3px 2px 3px; vertical-align: bottom;”>PersonB</td>
<td style=”overflow: hidden; padding: 2px 3px 2px 3px; vertical-align: bottom;”>typing</td>
<td style=”overflow: hidden; padding: 2px 3px 2px 3px; vertical-align: bottom; text-align: right;”>40</td>
<td style=”overflow: hidden; padding: 2px 3px 2px 3px; vertical-align: bottom; text-align: right;”>39</td>
</tr>
<tr style=”height: 21px;”>
<td style=”overflow: hidden; padding: 2px 3px 2px 3px; vertical-align: bottom;”>PersonB</td>
<td style=”overflow: hidden; padding: 2px 3px 2px 3px; vertical-align: bottom;”>typing</td>
<td style=”overflow: hidden; padding: 2px 3px 2px 3px; vertical-align: bottom; text-align: right;”>50</td>
<td style=”overflow: hidden; padding: 2px 3px 2px 3px; vertical-align: bottom;”></td>
</tr>
<tr style=”height: 21px;”>
<td style=”overflow: hidden; padding: 2px 3px 2px 3px; vertical-align: bottom;”>PersonB</td>
<td style=”overflow: hidden; padding: 2px 3px 2px 3px; vertical-align: bottom;”>typing</td>
<td style=”overflow: hidden; padding: 2px 3px 2px 3px; vertical-align: bottom; text-align: right;”>60</td>
<td style=”overflow: hidden; padding: 2px 3px 2px 3px; vertical-align: bottom; text-align: right;”>56</td>
</tr>
<tr style=”height: 21px;”>
<td style=”overflow: hidden; padding: 2px 3px 2px 3px; vertical-align: bottom;”>PersonC</td>
<td style=”overflow: hidden; padding: 2px 3px 2px 3px; vertical-align: bottom;”>texting</td>
<td style=”overflow: hidden; padding: 2px 3px 2px 3px; vertical-align: bottom; text-align: right;”>10</td>
<td style=”overflow: hidden; padding: 2px 3px 2px 3px; vertical-align: bottom; text-align: right;”>12</td>
</tr>
<tr style=”height: 21px;”>
<td style=”overflow: hidden; padding: 2px 3px 2px 3px; vertical-align: bottom;”>PersonC</td>
<td style=”overflow: hidden; padding: 2px 3px 2px 3px; vertical-align: bottom;”>texting</td>
<td style=”overflow: hidden; padding: 2px 3px 2px 3px; vertical-align: bottom; text-align: right;”>20</td>
<td style=”overflow: hidden; padding: 2px 3px 2px 3px; vertical-align: bottom; text-align: right;”>22</td>
</tr>
<tr style=”height: 21px;”>
<td style=”overflow: hidden; padding: 2px 3px 2px 3px; vertical-align: bottom;”>PersonC</td>
<td style=”overflow: hidden; padding: 2px 3px 2px 3px; vertical-align: bottom;”>texting</td>
<td style=”overflow: hidden; padding: 2px 3px 2px 3px; vertical-align: bottom; text-align: right;”>30</td>
<td style=”overflow: hidden; padding: 2px 3px 2px 3px; vertical-align: bottom; text-align: right;”>30</td>
</tr>
<tr style=”height: 21px;”>
<td style=”overflow: hidden; padding: 2px 3px 2px 3px; vertical-align: bottom;”>PersonC</td>
<td style=”overflow: hidden; padding: 2px 3px 2px 3px; vertical-align: bottom;”>texting</td>
<td style=”overflow: hidden; padding: 2px 3px 2px 3px; vertical-align: bottom; text-align: right;”>40</td>
<td style=”overflow: hidden; padding: 2px 3px 2px 3px; vertical-align: bottom; text-align: right;”>39</td>
</tr>
<tr style=”height: 21px;”>
<td style=”overflow: hidden; padding: 2px 3px 2px 3px; vertical-align: bottom;”>PersonC</td>
<td style=”overflow: hidden; padding: 2px 3px 2px 3px; vertical-align: bottom;”>texting</td>
<td style=”overflow: hidden; padding: 2px 3px 2px 3px; vertical-align: bottom; text-align: right;”>50</td>
<td style=”overflow: hidden; padding: 2px 3px 2px 3px; vertical-align: bottom;”></td>
</tr>
<tr style=”height: 21px;”>
<td style=”overflow: hidden; padding: 2px 3px 2px 3px; vertical-align: bottom;”>PersonC</td>
<td style=”overflow: hidden; padding: 2px 3px 2px 3px; vertical-align: bottom;”>texting</td>
<td style=”overflow: hidden; padding: 2px 3px 2px 3px; vertical-align: bottom; text-align: right;”>60</td>
<td style=”overflow: hidden; padding: 2px 3px 2px 3px; vertical-align: bottom; text-align: right;”>56</td>
</tr>
</tbody>
</table>
etc.; though it’s possible that PersonA could have data from more than one activity.I transformed your data table into this new format in this Google Sheet; look in row 26 etc. There might have been a better (more elegant) way to do it, which I look forward to learning about from anyone who knows it!
If that’s right and it’s formatted that way, then you could make a scatterplot with x=duration, y=count, with the legend variable (the variable that you “drop in the middle of the graph” to color the dots by) being the activity. Then if you add a trendline, you should get one trendline for each activity.
Visually, that might be a bit much. And it’s not clear which trendline is for which activity. You could make another graph with x=activity (and no y axis) to show dots for each activity, then select the dots for one activity, then on the scatterplot use the “View” icon and click “Hide Unselected Cases”. You could repeat (having to make a separate graph each time, I think) for the other activities.
To get the trendline slope and intercept etc. in a table, you can make columns in CODAP like this (feel free to use better column names; ignore whatever you don’t want)
column name: corr ; formula: correlation(Duration,HowManyTimes)
column name: linSlope ; formula: linRegrSlope(Duration,HowManyTimes)
column name: linIntercept ; formula: linRegrIntercept(Duration,HowManyTimes)
column name: DurationCount ; formula: count(Duration)
column name: resultCount ; formula: count(HowManyTimes)
At first all of those will have the same values, aggregating across all the activities in the table. But if you drag the “activity” column to the far left (so a yellow box appears that says “drop attribute to create new collection”), then the results will be different for the rows with different activities. You can also drag corr, linSlope, etc. all the way to the left as well to get a little table that summarizes by activity.
I tried it all in this codap file.
The data formatting issue reminds of what people in the R software universe call “tidy” data. The data that you have is in “wider” form, while the format I’m suggesting is “longer”; see https://tidyr.tidyverse.org/articles/pivot.html .
Andrew RossParticipantThanks! Sounds like I should actually treat it like Numeric then.
December 13, 2021 at 3:44 pm in reply to: graph forgets to show mean after using Clear Data in Sampler #6769Andrew RossParticipantOk, that workaround is working for me. I hadn’t thought of that. Thanks!
Andrew RossParticipantIt hasn’t happened to me in a while. I don’t think I ever did something that “solved” it, it just stopped happening. So I’m sorry I don’t have any ideas on what else to try that I know would work.
But, I wonder if trying a different browser (Firefox vs Chrome) might help, if you can try switching.
Andrew RossParticipantI’m doing this from an office computer on wired ethernet in a college campus building, so it should be a pretty reliable internet connection, but I guess it could flake out every now and then. A browser caching issue could be it too. Thanks for the hints; I will try them next time it happens, and let you know if I learn anything.
Andrew
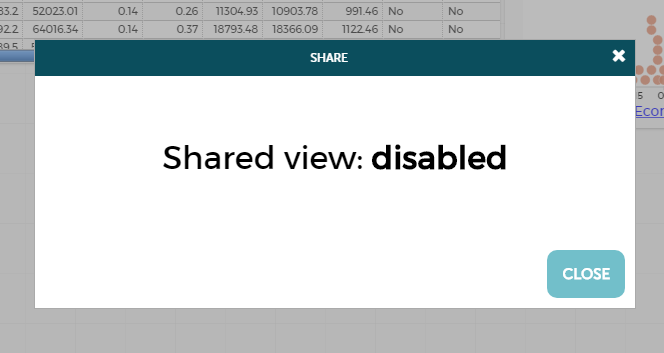
Andrew RossParticipantMaybe I’m not understanding what it means to make a copy of the document, adjust it, and then send out a share link to that copy. I thought that was one of the methods I had tried, and still got the sharing-is-disabled box with no enable-sharing button. Do you mean using “hamburger”->”Create a Copy”? That’s what I was doing. Of course it seems to be working now, but it seems to be random as to whether it works or not, looking back at my past few months of using CODAP.
Thanks,
Andrew
Andrew RossParticipantOk, that attachment didn’t work; it wasn’t permitted due to security purposes. Here’s the shared link that we plan on giving to students:
https://codap.concord.org/app/#shared=44925
(in case the URL gets removed, here’s the key part: shared=44925 )
I just wanted to make 2 graphs on it, then get a new shared URL without updating the shared view.
Thanks,
Andrew
Andrew RossParticipantIt’s not “large” by CODAP standards, then. It has 49 or 50 rows, and about a dozen columns. I’ll try to attach the downloaded CODAP file here, in case that helps.
Thanks,
Andrew
Andrew RossParticipantNo, it doesn’t have buttons like that. Here’s what I see (attached).
I also just noticed that there’s a yellow frame around the CODAP window (inside the browser tab). I don’t know what that means but it seems like it might be relevant.
It just occurred to me that it might be my ad-blocker, AdBlock Plus, but then I turned it off and tried again in that window and the dialog box for sharing still didn’t have the enable-sharing button. But now I’ve tried opening new windows, uploading the local file, and then sharing, and the dialog box _does_ have the enable-sharing button. This is all in Chrome, in case that’s relevant.
Thanks,
Andrew
Attachments:
-
AuthorPosts