Introduction to Maps
Get started with maps
- Note that the Four Elephant Seals CODAP example document shown in the video above can be found here.
- Display a map. Click the map icon on the top toolbar. If a table within CODAP contains mapping data (columns labeled as longitude and latitude), a map of the corresponding points will be displayed automatically. Note: there has to be one column labeled longitude and another column labeled latitude for the map to display properly–using other names for these columns will lead to the map not displaying the cases (lat and lon or long also work as shorthands for latitude and longitude). Note also that latitude and longitude should be specified as positive/negative decimal degrees (for example, for La Paz, Bolivia, one would specify the latitute as -16.49 and the longitude as -68.12).
- If the table does not contain mapping data, a Google API map opens, without CODAP data.
- Toggle between map styles (Oceans, Topo, or Streets) using the inspector palette to the right of the map (click on the “Layers” icon, then select Oceans, Topo, or Streets).
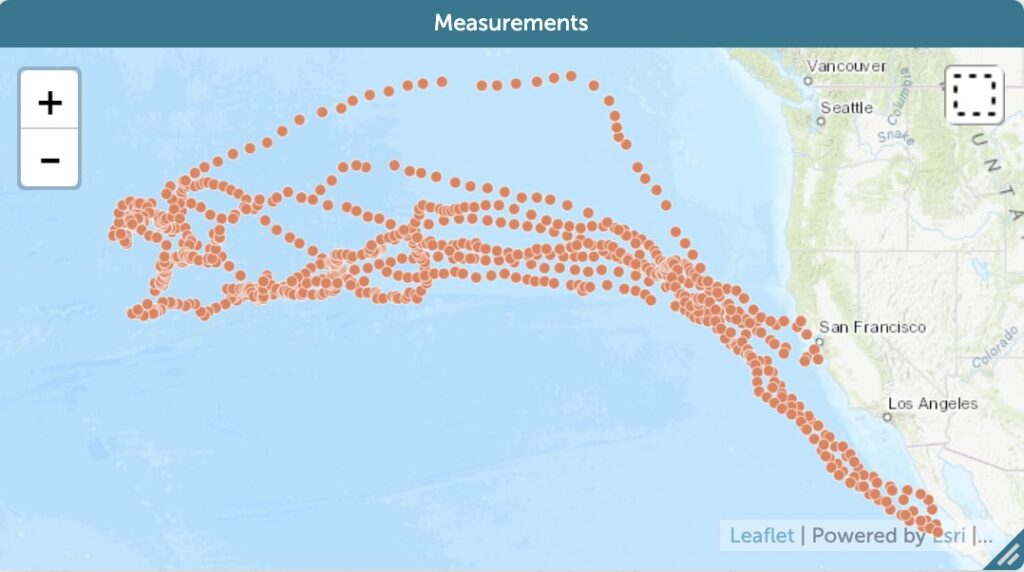
- If latitude and longitude data are included in a data set, CODAP will plot the data points on a map.
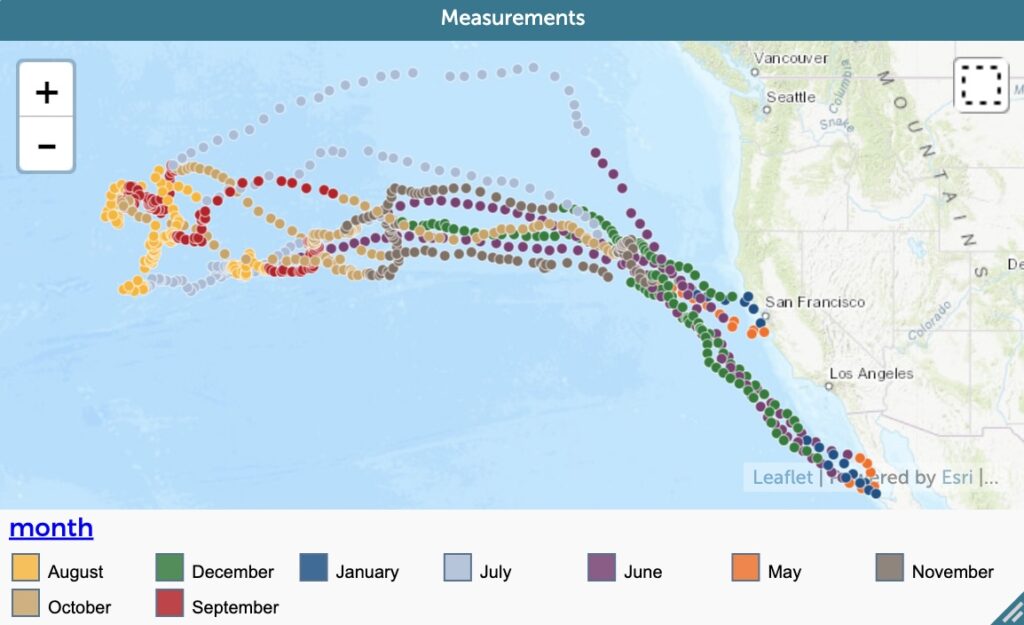
- Drag and drop an attribute from a table onto the map to view mapped data for that attribute. This will color the points by that attribute. For categorical attributes, the points corresponding to each distinct category will get a distinct color, as shown on the map’s legend. You can learn about how coloring works for numeric attributes here.
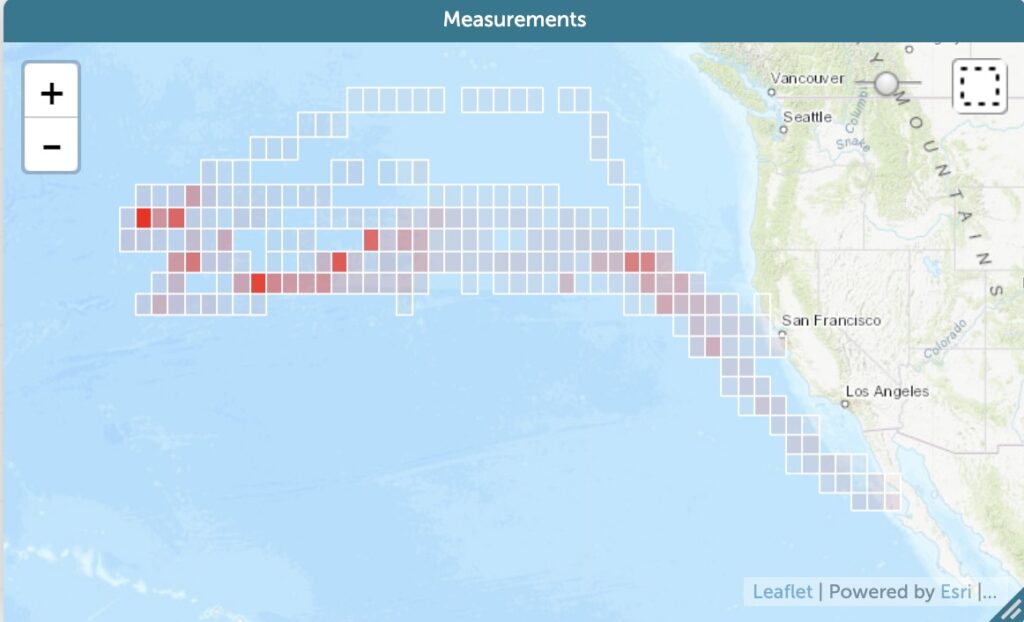
- View data by frequency. Click on the ruler icon in the inspector panel to the right of the map. Then, select the “Show Grid” tool from the ruler menu to view data on the maps in coarse-grained bins. Use the slider displayed during grid view to adjust the size of the grid cells and discover new patterns. Note: Deselect “Points” from the ruler menu item to focus solely on the grid view.
- To adjust the map’s center point drag on the map. Click the dotted square at the map’s upper right to enable a selection crosshairs. Click on the eye icon in the inspector panel to the right of the map to hide or view only the selected cases.
- Zoom in or out on the map by clicking the + or – sign in the top left corner. Or, double click to zoom in, or hold down shift and double click to zoom out.
- See here for information on how to select data on maps.
Maps with boundaries
If a CODAP document contains map boundary data, CODAP will display the information on a map. For example, the graph on the right contains information about the Total Population in the United States.
- Display maps with geographic boundaries. CODAP can also create maps with geographic boundaries if the boundary information is included in a dataset, like in the map above. To do so, drag a boundary attribute from a table onto the map. To add boundary information to a dataset, add a new attribute to a table by clicking the plus sign in the upper right corner. Give the attribute a new name if you like, such as “Boundary” (click on the name of the new attribute and select “Rename”). Then, click on the name of the new attribute in the table and select “Edit Formula.” Next, type in a formula to look up the boundary based on another attribute in the dataset. Typically this is an attribute specifying the name of the geographic areas. For example, the formula used to create state boundaries in the example shown above is: lookupBoundary(US_state_boundaries, state) (in this formula, “state” is an attribute specifying the state names in this dataset, while “US_state_boundaries” is a set of boundaries where CODAP looks for the boundaries for the states listed under the “state” attribute). Once the boundary variable is added to the table, the boundaries will appear on the map. More information on how to enter a formula for an attribute can be found here and more information on the boundary lookup formulas can be found here. CODAP contains boundary sets for US states, counties, congressional districts, Public Use Microdata Areas (PUMAs). If you would like to create a map with other boundaries in CODAP, see the help page for How to Create a Map with Custom Boundaries.
- You can also color boundries by an attribute’s values by dragging that attribute onto the graph. For categorical attributes, the boundaries for each distinct category will get a distinct color, as shown on the map’s legend. You can learn about how the coloring works for numeric attributes here.
- See here for information on how to select data on maps.
An example CODAP document with a map with boundaries can be found here.
More detailed information on maps in CODAP can be found in the chapter on maps in Awash in Data by Tim Erickson.