Introduction to Graphs
Get started with graphs
- Create a new graph. Once you have created at least one table in CODAP, click the graph button on the top toolbar.
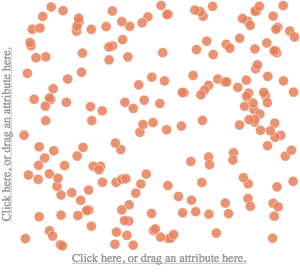
- Note: Graphs start as a configuration of randomly scattered data points.
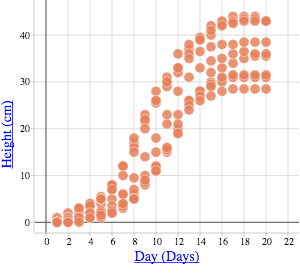
- Drag attributes (variables) from the column headers of the tables onto the horizontal (x) and vertical (y) axes to view a graph of those variables.
- Create additional graphs to explore different relationships.
How to edit graphs
- Drag axes to change the graph’s scale and origin.
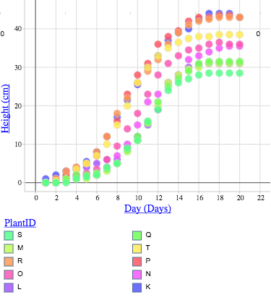
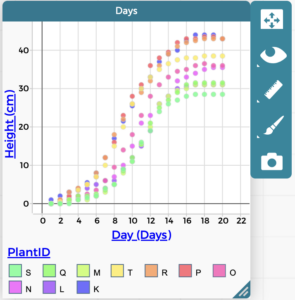
- Drop an attribute onto the center of a graph to color the display according to the attribute.
- Change the graph axes. Drag new attributes to the axes. Or click on the axis title to display a menu of attributes.
- Click on the ruler icon in the inspector panel to the right of the graph to show or hide connecting lines between points, add a moveable line to your graph, or plot any of a wide variety of functions on top of the graph’s data.
Icons in the graph inspector panel
Several icons appear in the inspector panel to the right of a graph when you select it (click on it). These icons and their uses are described below.
Rescale. Automatically rescale the graph to show all data points. See also this page.
Eye. Show or hide data based on selections.
Ruler. Calculate statistics, including mean, median, and standard deviation. See also this page.
Paintbrush. Change the color and point size of your data.
Camera. Screen capture your graph and save the PNG file. See also this page.
You can find additional information on how to work with graphs here.