Working with Date/Time Data
In addition to numeric, categorical, and several other attribute types, CODAP can handle date/time attributes in tables, maps, and graphs.
Entering and Formatting Dates/Times in a Table
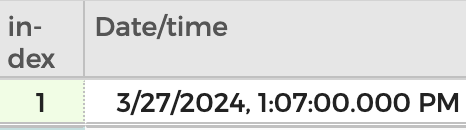
In order for CODAP to interpret an attribute as consisting of dates/times, the data must be formatted in the table in certain ways. The following shows an example of the general date/time format that CODAP expects, using the date March 27, 2024 and the time 1:07 pm. It is possible to specify the time down to the millisecond, if desired. Note that CODAP uses U.S. date format, so the month comes before the day. Also, CODAP assumes that times are Coordinated Universal Time (UTC) (if you have times from multiple different time zones, you may wish to convert them all to UTC time).
There are multiple different ways one could enter the date/time above such that CODAP would recognize it as a date/time. The following are a few examples that also work:
March 27, 2024, 01:07 pm
27 March 2024 13:07
03/27/24 1:07 PM
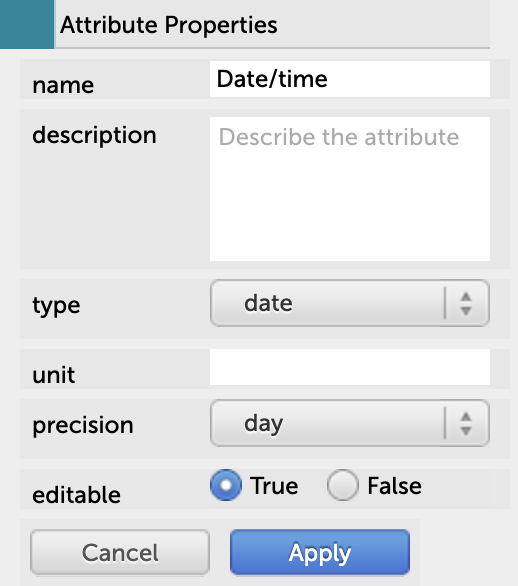
A best practice is to edit attribute properties for your date/time attribute and specify the attribute type as “date,” as shown below.
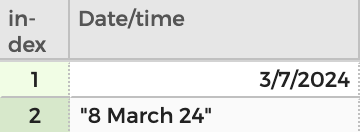
If you specify the attribute type as date but CODAP does not recognize a value for that attribute as a valid date/time, quotation marks will appear around the value, as seen in the 2nd row below for “8 March 24.” If you see quotation marks, you should reformat the value until CODAP accepts it as a date/time and the quotation marks disappear. In this case, changing it to “8 March 2024” would fix this.
Note also when editing attribute properties one can change the precision to specify how much of the date/time to display in the table. In the example right above, the precision is set to day, so the table shows the day, month, and year but not the time. If time is not specified for a given date, CODAP assumes it to be 12:00:00.000 AM UTC, so setting precision to “day” is especially useful if you don’t have times you are interested in looking at. However, there are certain cases where you will see 12:00 AM even if you never entered in a time, for example, in the yellow tooltip box that appears when mousing over a point on a graph. CODAP also assumes that you are entering in at least a day, month, and year for each date/time value, so you cannot have a date/time attribute that has times but no dates (or months and years but no days, or days and months but no years)
If you have an existing dataset and it has many date/time values in it that need reformatting for CODAP to recognize them, it is often easier to use a tool such as Excel or Google Sheets for reformatting before importing the data into CODAP.
For more information on date/time formats in CODAP, read chapter 19 of Tim Erickson’s book Awash in Data.
There are also a dozen date/time functions that one can apply to date/time attributes to create new attributes in a table.
Graphs With Dates/Times
One useful graph is to plot a date/time attribute on one axis. In the example below, CODAP is treating “date” as a categorical attribute (note the vertical lines separating each data point), not as a date/time attribute, because the selected case (in blue) is missing the required comma between “May 14” and “2019.”
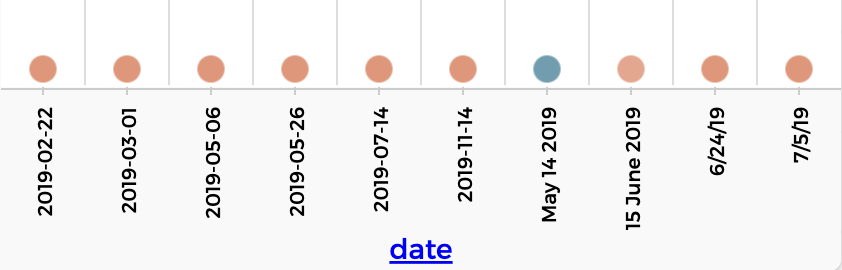
Changing that value in the table to “May 14, 2019” and then creating a new graph of “date” results in the following, properly formatted date/time graph. Note that the lines between cases have disappeared and the axis looks like a timeline with months and years.
Here are a few additional graphs you might want to make with a date/time attributes:
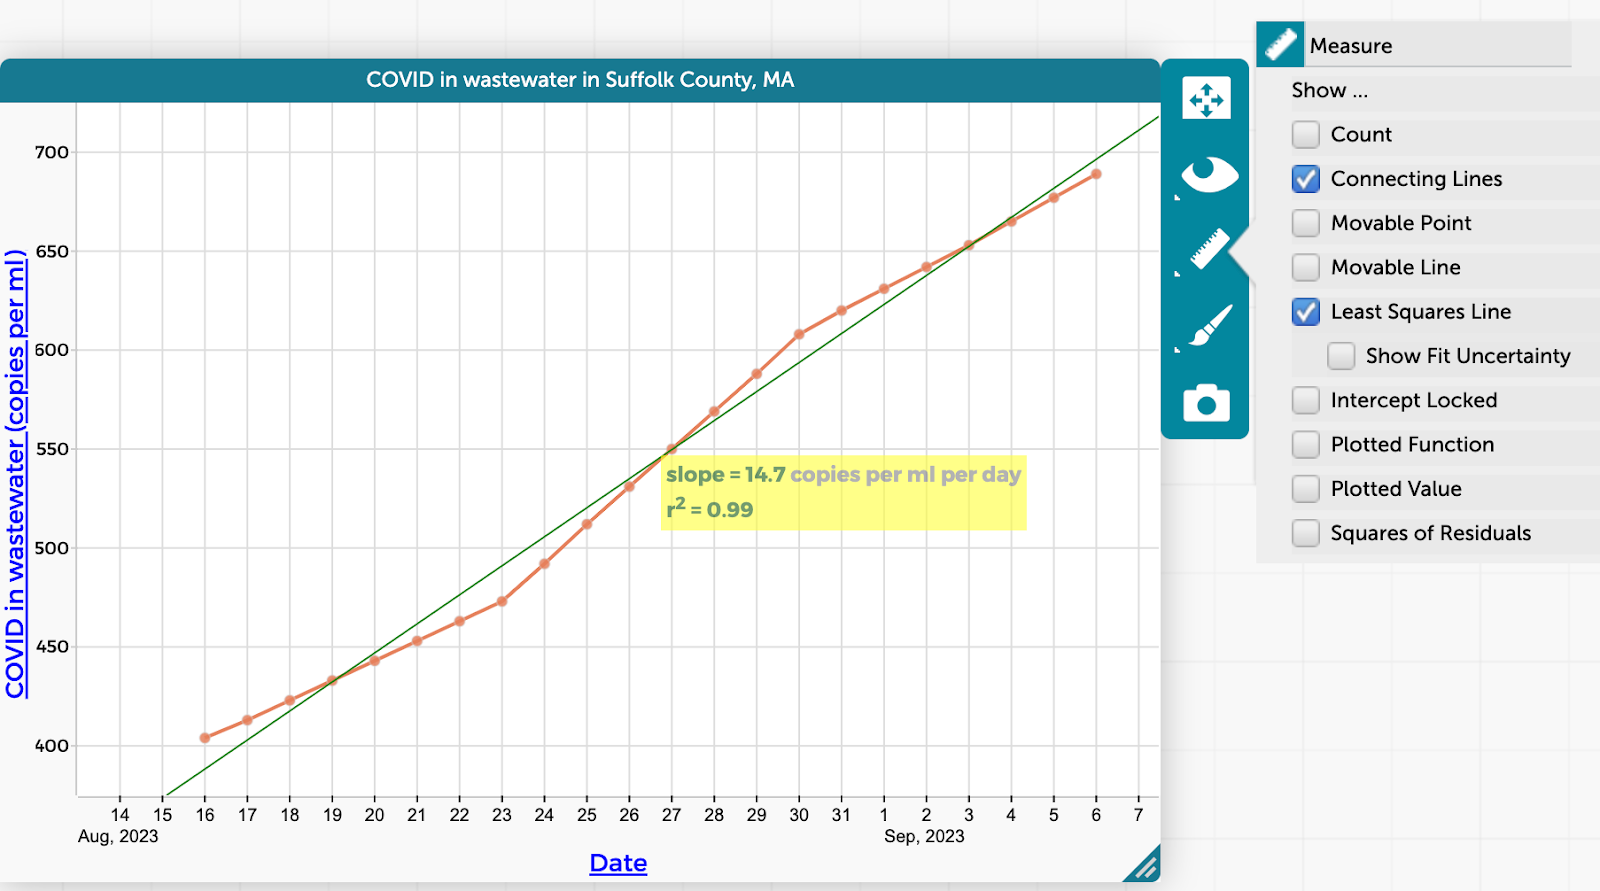
1) Plot a least squares regression line showing the correlation between date/time and a numeric attribute, as shown in the example below. Note that the slope for the least squares line (shown in the yellow tooltip box) will be expressed as a rate per a certain time unit (in the example below, it is an increase of 14.7 copies per ml per day).
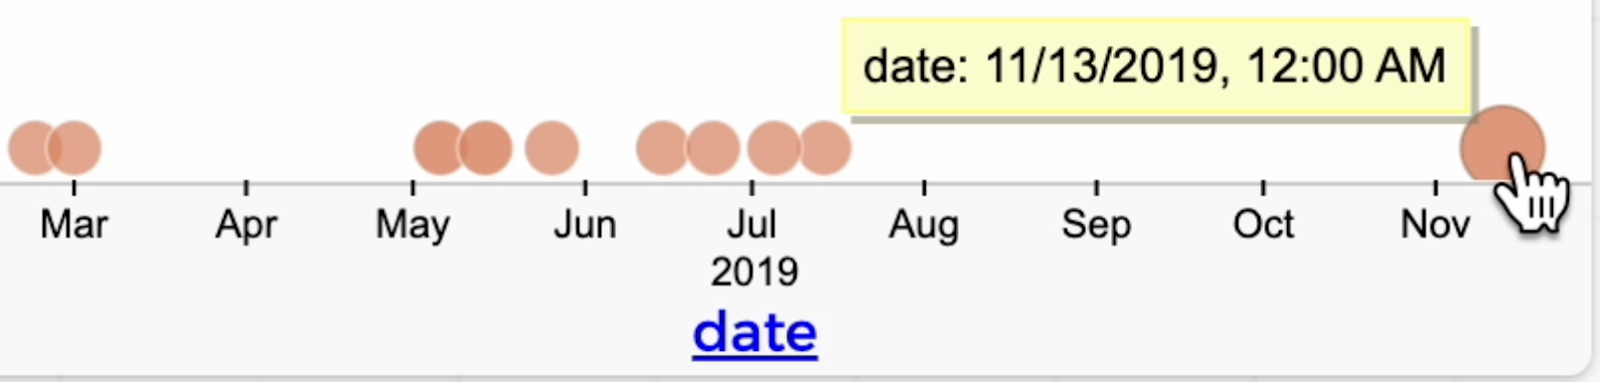
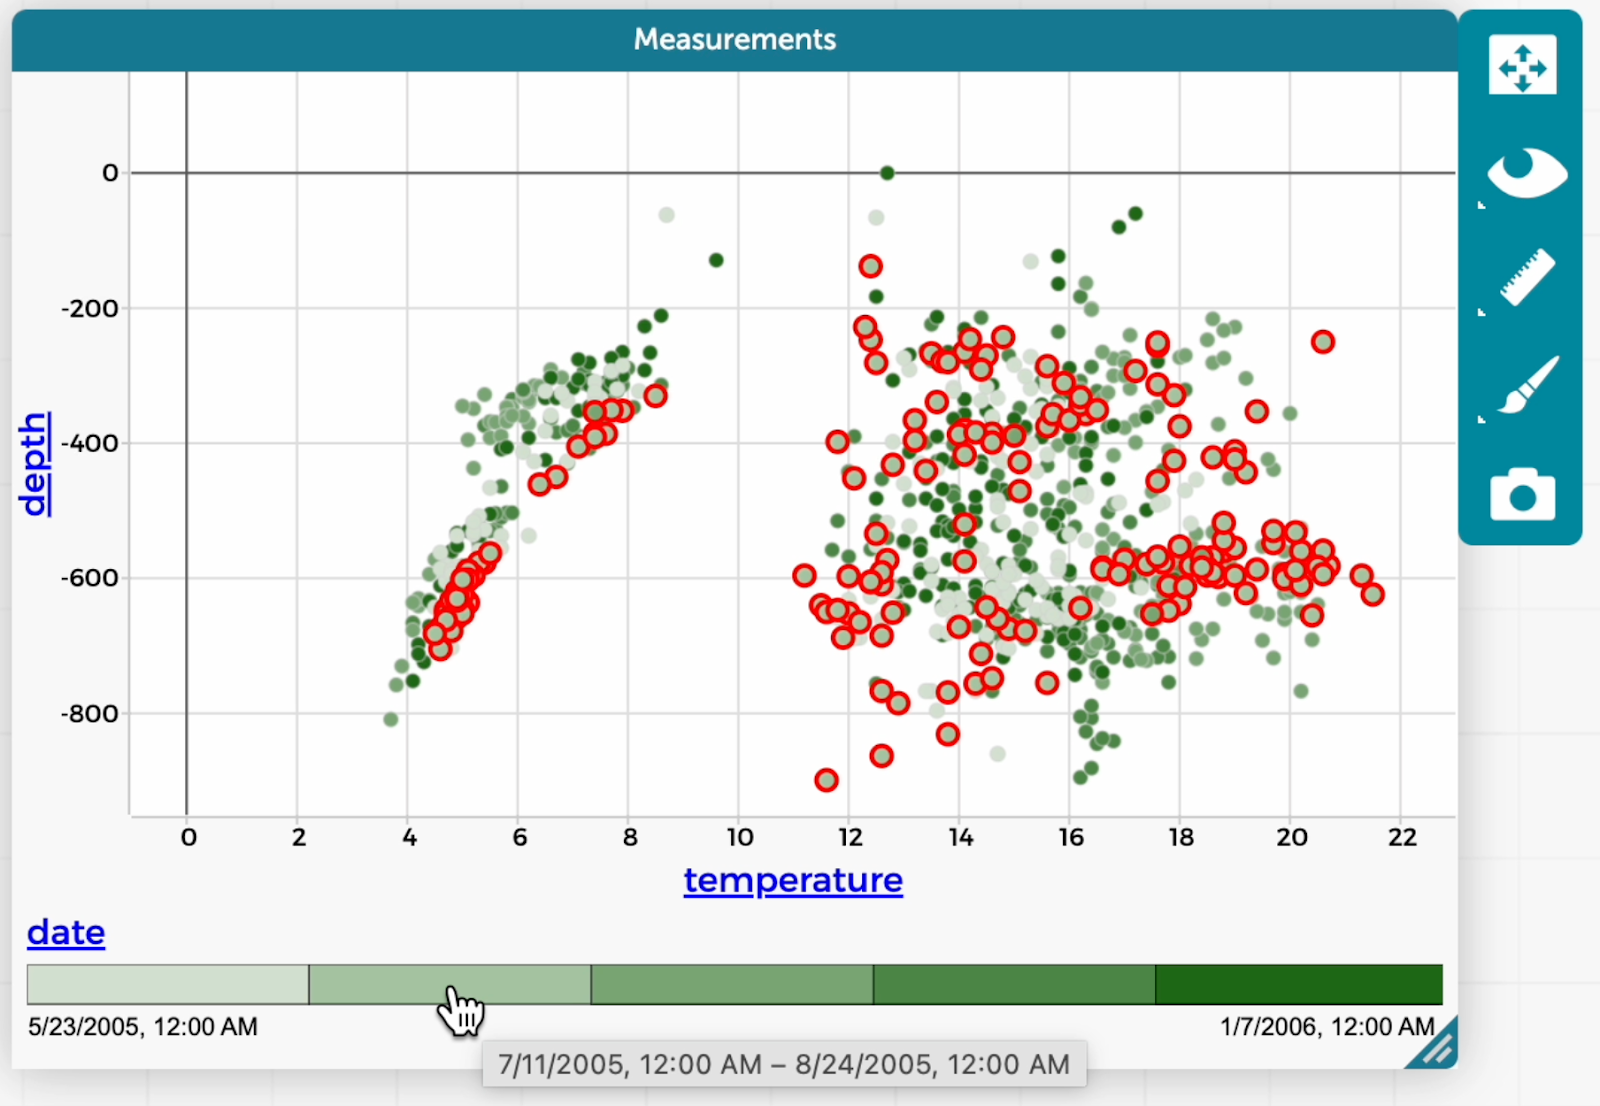
2) Color points on a graph by a date/time attribute: As mentioned in this help page, it is possible to color points on a graph by values of a date/time attribute. Simply drag the heading of the date/time attribute of interest from the table and drop it in the middle of the graph. Below shows an example of what this looks like. The cases in the dataset are automatically divided into five groups/bins of equal size, with each group corresponding to a color/date range indicated in the colored bands in the legend below the graph. If you mouse over a band in the legend, a gray box appears to indicate the exact date/time range of that band. Clicking on a color in the legend selects all the points on the graph with the corresponding date/time range (in the example below, the second band from the left is selected). This FAQ page provides more information on how such legends work.
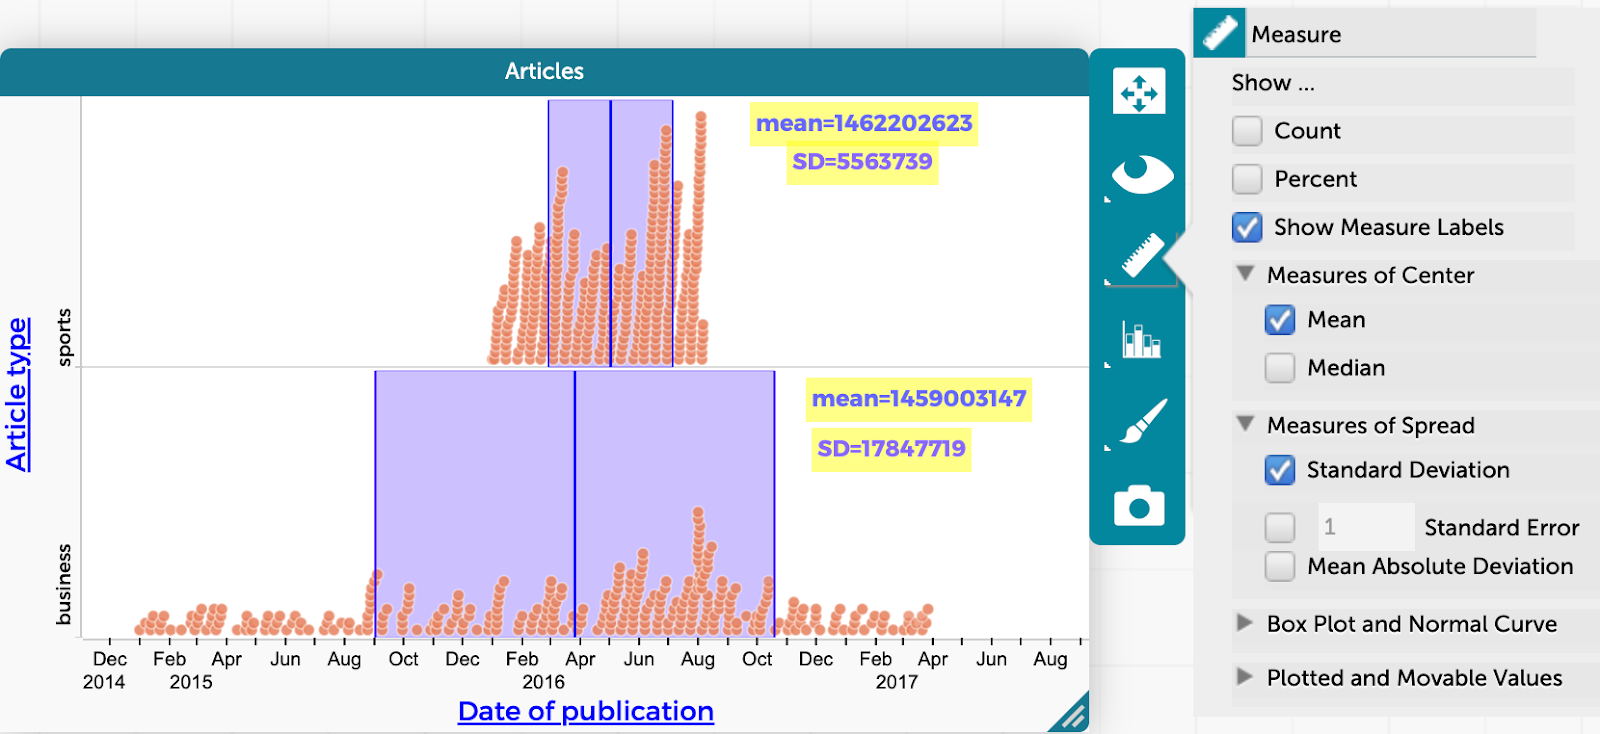
3) Plot a distribution of dates (perhaps split by a categorical attribute on the other axis), which you could then explore using tools such as box plots or showing the mean, median, standard deviation, etc. on the graph. See the example below, which shows the mean and one standard deviation on either side of the mean to compare the distributions of news article publication dates for articles on business (bottom) vs. sports (top). Note that the measure labels for the means and the standard deviations were added to the graph by checking “Show Measure Labels” in the Measure palette to the right of the graph. For the two means, these numbers are the mean Unix timestamps, the number of seconds elapsed since January 1, 1970 for the dates of publication, in UTC time. The SD values are the total number of seconds that one standard deviation represents.
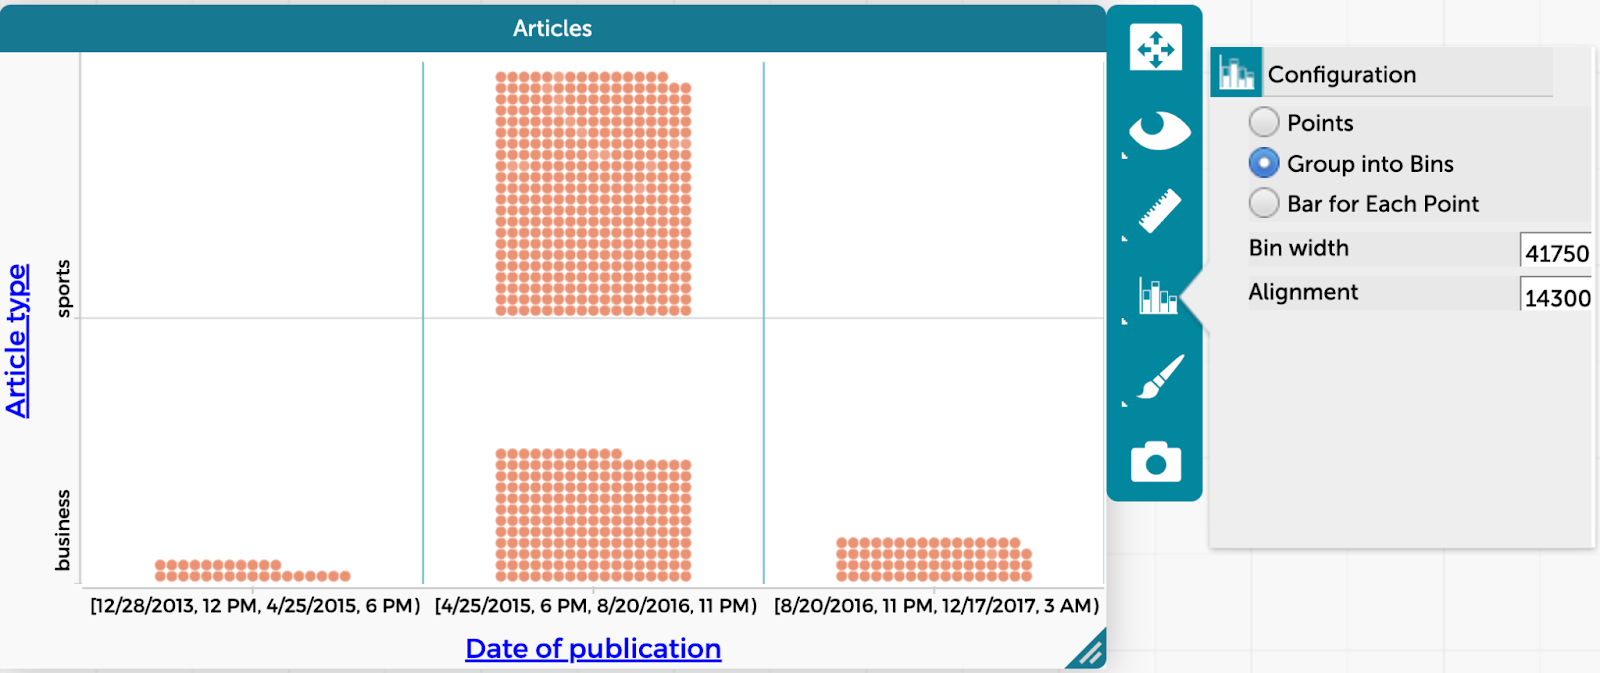
4) Bin a date/time attribute along a graph’s axis, as shown in the example below. The procedure for doing this is similar to binning a numeric attribute on a graph. The square bracket at the beginning of the date/time range for a given bin is inclusive, while the round bracket/parenthesis is exclusive. Also, note that the start and end date/time values for each bin are separated by commas. The easiest way to change the bin width is by dragging the lines in between bins (the vertical lines in the example below). The Configuration palette to the right of the graph allows you to type in bin width and alignment values for date/time attributes, but this can be tricky to do since it is expecting seconds for bin width and a Unix time stamp (seconds elapsed since January 1, 1970) for alignment.
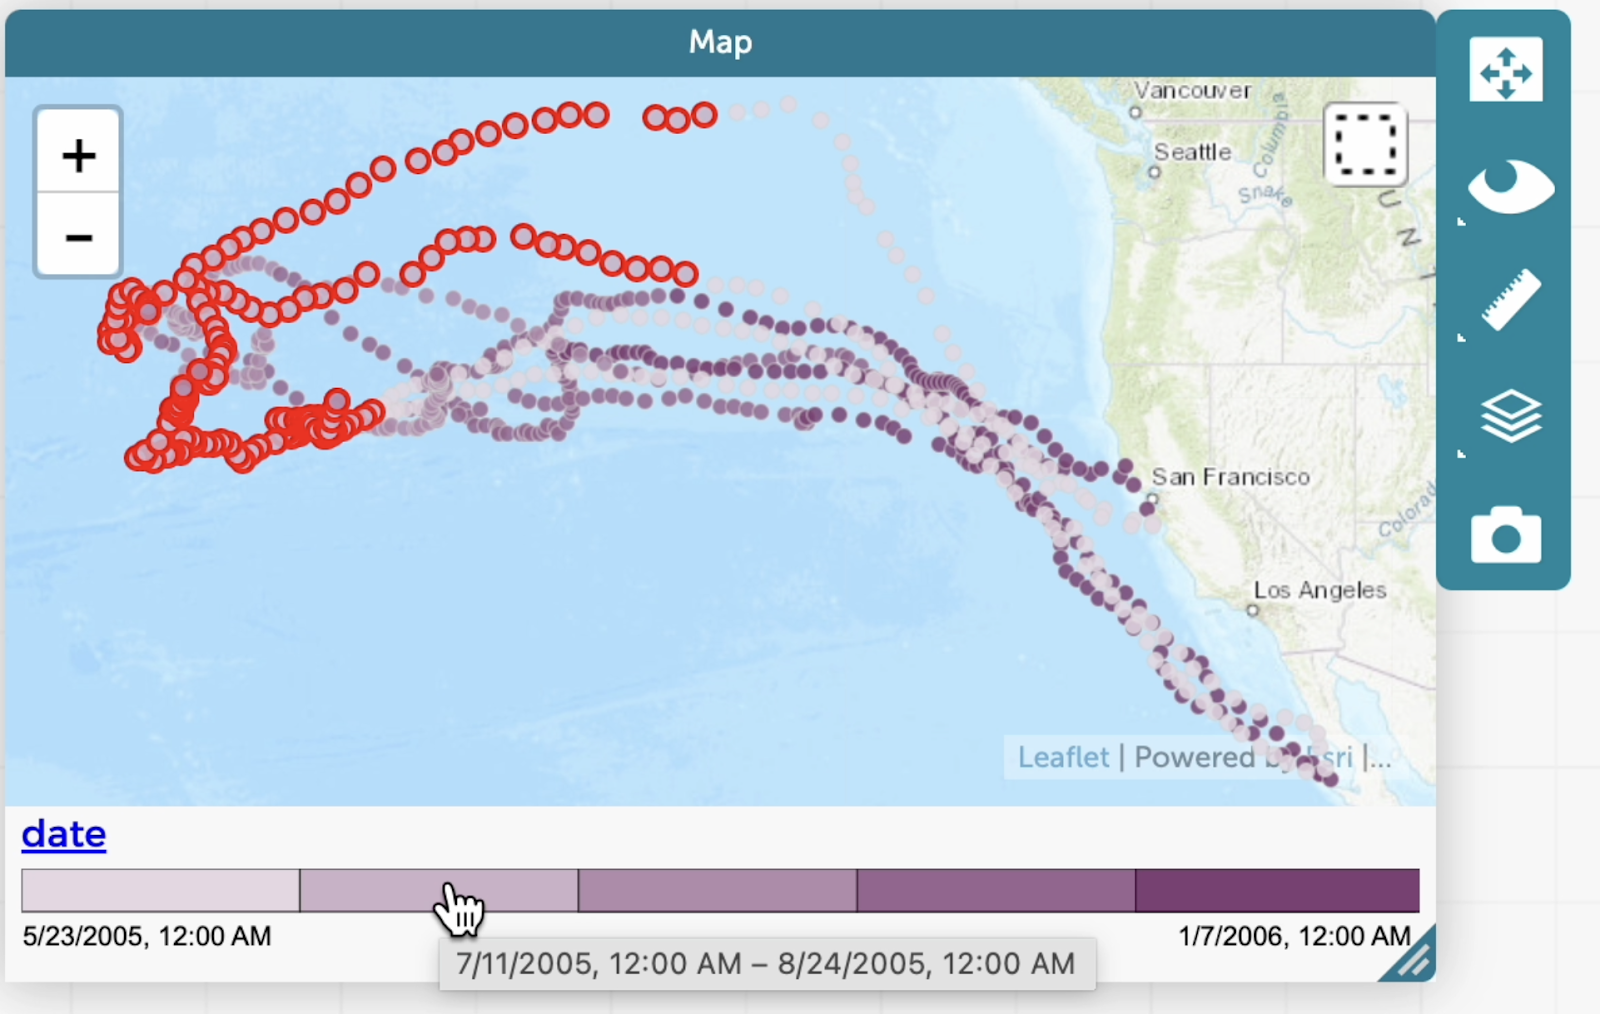
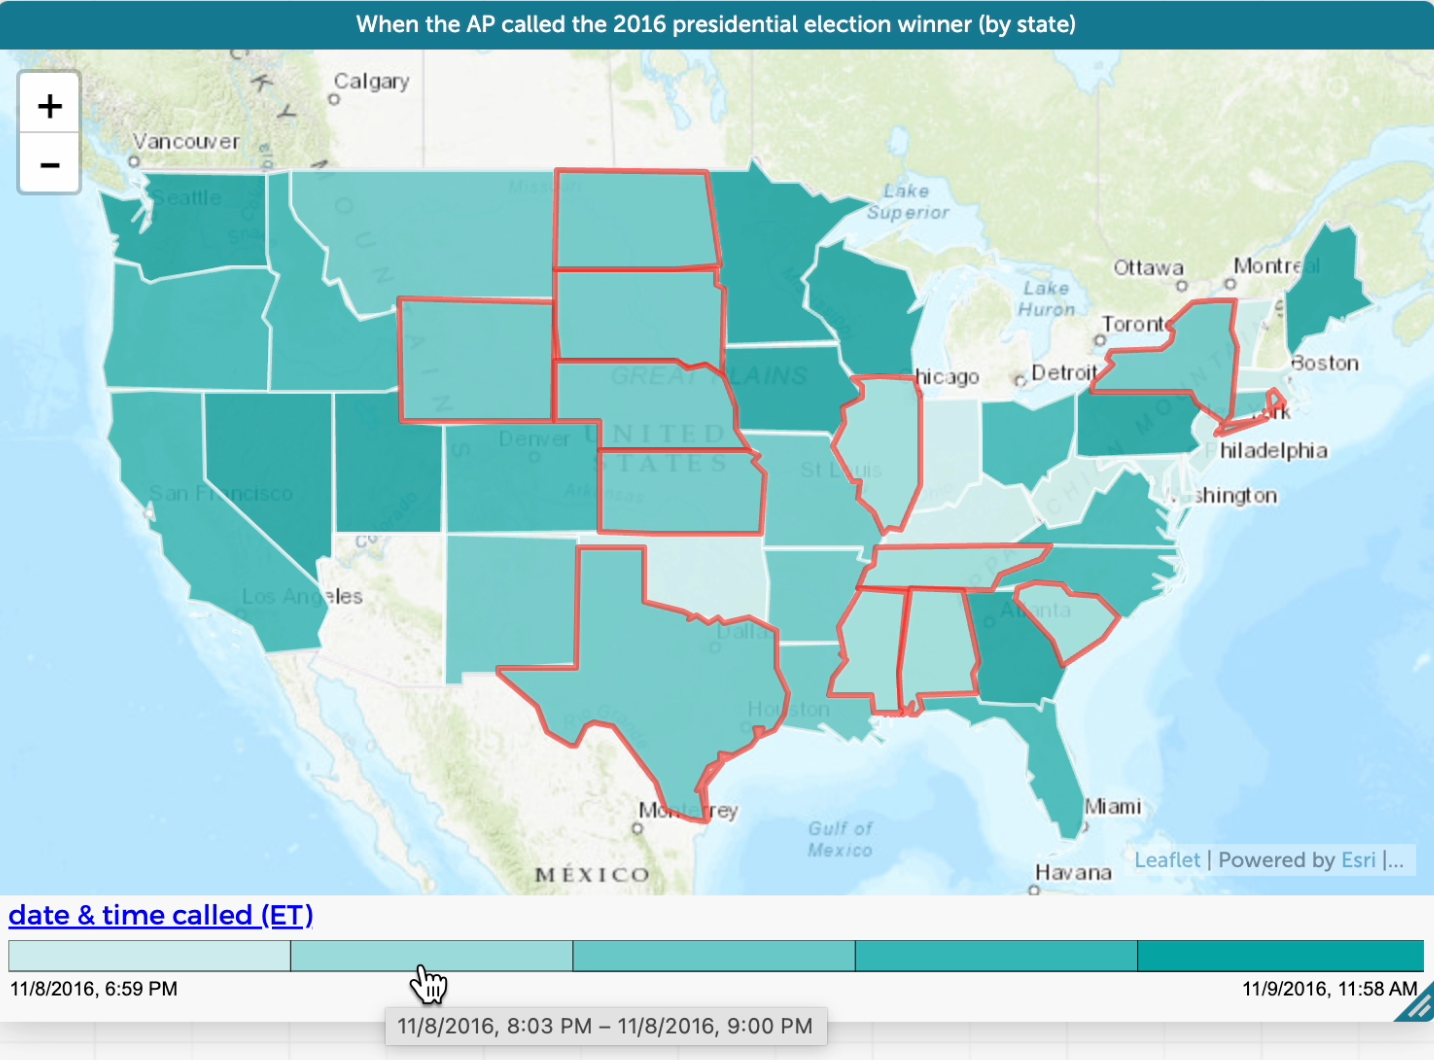
Maps With Dates/Times
You can also add a date/time attribute as a layer in color to a map. To do so, drag the heading for the date/time attribute of interest from the table and drop it on the map. The principles for how points or boundaries become colored on maps by date/time values are the same as those discussed above for coloring points on a graph by date/time values (see also this FAQ). For more info on working with maps in CODAP, see this help page. Below are two examples of coloring CODAP maps by date/time attribute values.