Add Counts/Percentages to Categorical Attribute Graphs
For a graph with a categorical attribute on at least one axis, it is possible to count the number (and percentage) of cases belonging to each category.
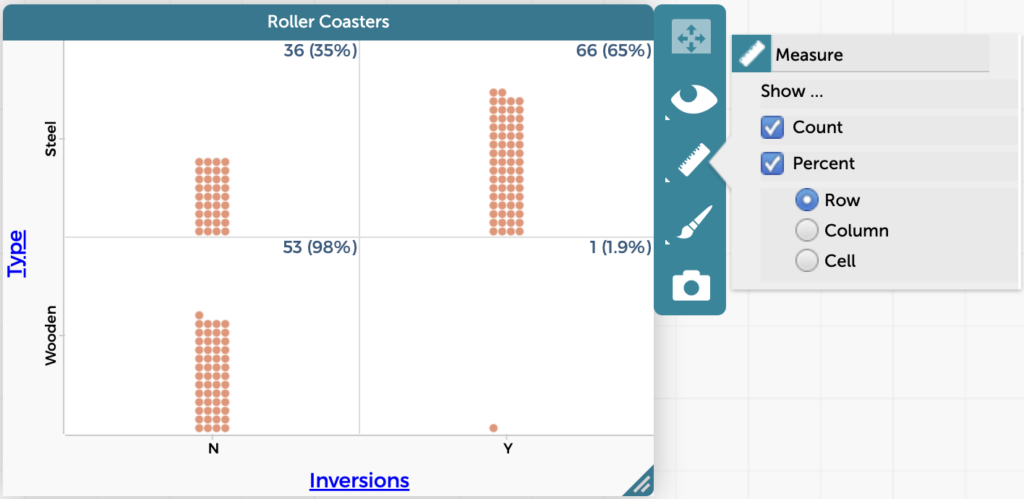
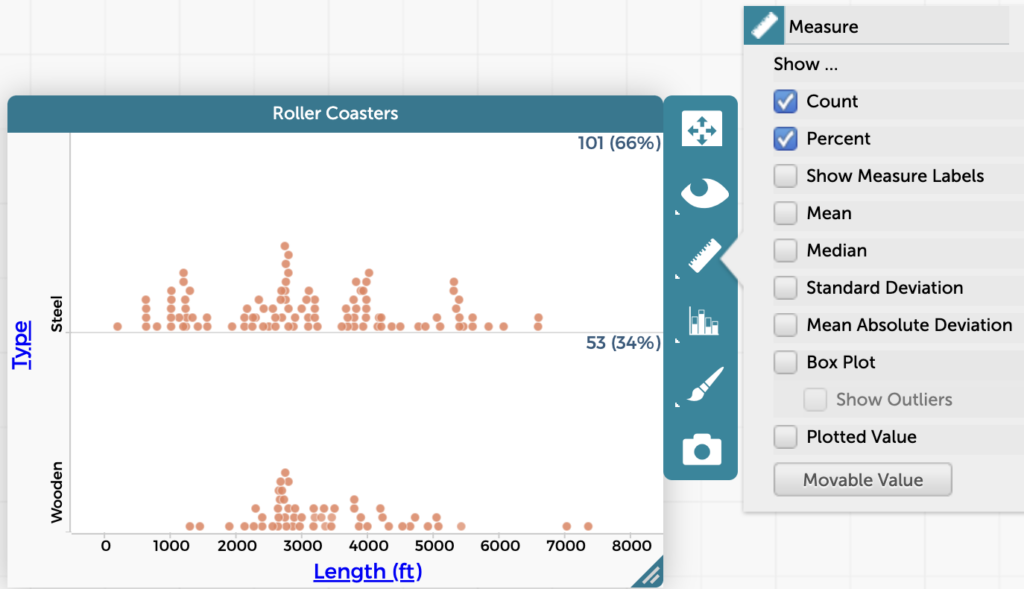
To add the counts, click on the ruler icon in the inspector palette to the right of the graph and check the box for “Count.” To add percentages, check the box for “Percent.”
If both of the graph’s axes have categorical attributes, you can select “Row,” “Column,” or “Cell” percentages. In the example below, percentage by row is selected. This means the percentages add up to 100% across each row. So, for example, 98% of the wooden roller coasters have no inversions, while 1.9% of them have inversions. Column percentages, in this example, would be, for instance, the percentage of roller coasters with no inversions that are steel vs. wooden. Cell percentages are for each cell, out of the entire data (for example, the percentage of all of the roller coasters that are both steel and have inversions). When using percentages with categorical attributes on both axes, it is important to think carefully about whether to use row, column, or cell percentages, and to think carefully about what the percentages values are telling you.