Create a Histogram
In CODAP, a histogram is essentially a dot plot where the points have been grouped together into bins and then fused into rectangles. A histogram can be created from a CODAP graph with a numeric attribute on one axis (and the other axis left blank), such as the following example:
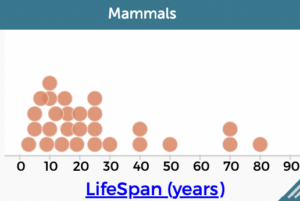
Note that while this is not yet a histogram, the points do stack above values they share in common.
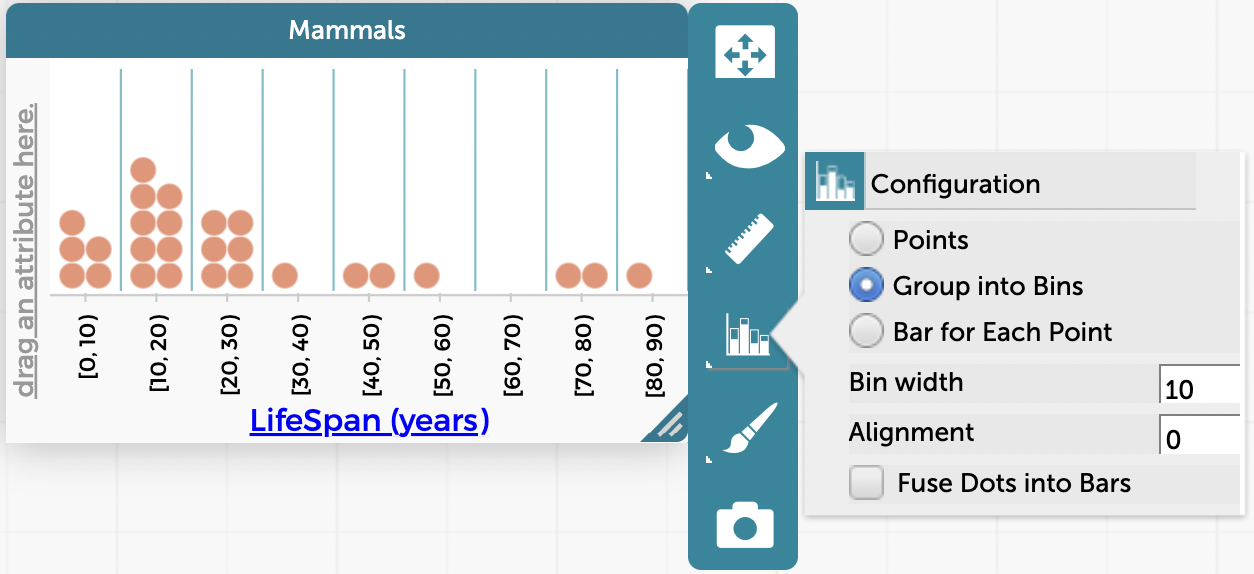
If you want to create a histogram from this graph, first click on the Configuration icon (![]() ) in the inspector panel to the right of the graph and select “Group into Bins.” After you have grouped the data into bins, you can adjust the bin width or alignment as you like. For more details on grouping into bins, see How to Group Numerical Data into Bins on a Graph.
) in the inspector panel to the right of the graph and select “Group into Bins.” After you have grouped the data into bins, you can adjust the bin width or alignment as you like. For more details on grouping into bins, see How to Group Numerical Data into Bins on a Graph.
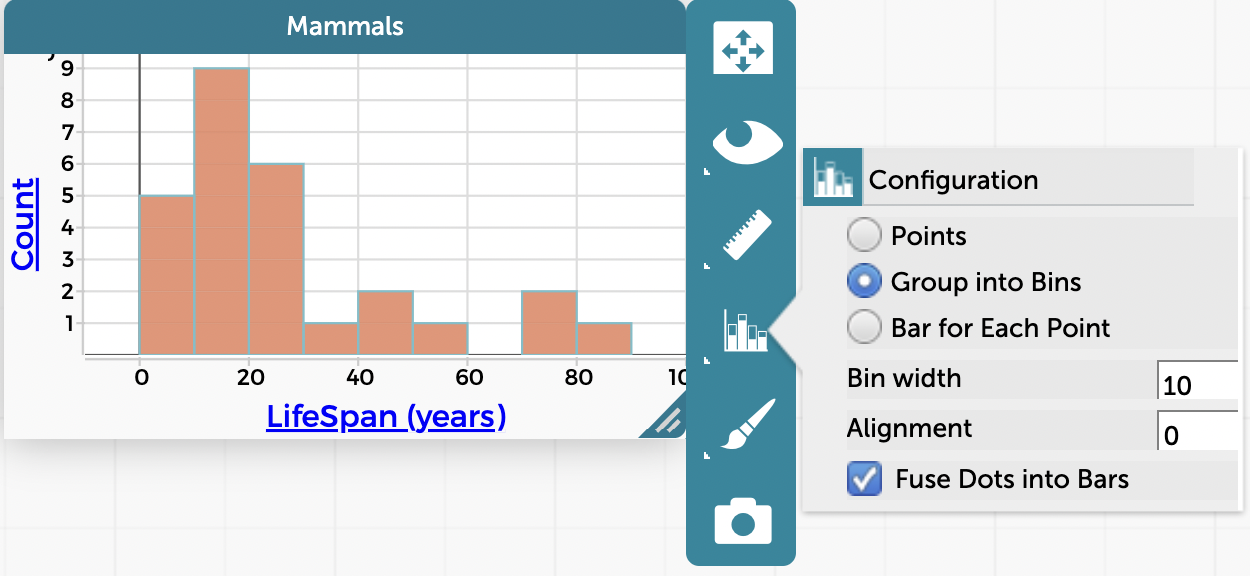
Finally, go back to Configuration and select “Fuse Dots into Bars.” Note that you can still use Configuration to further change the bin width if you want, or you could go back to viewing the data as a dot plot. For more details on fusing dots into bars, see How to Fuse Dots into Bars and Use a Formula to Determine Bar Length.