Plot a Function on a Graph
It is possible to graph a function to fit plotted data in CODAP. This works with graphs that contain two numeric attributes.
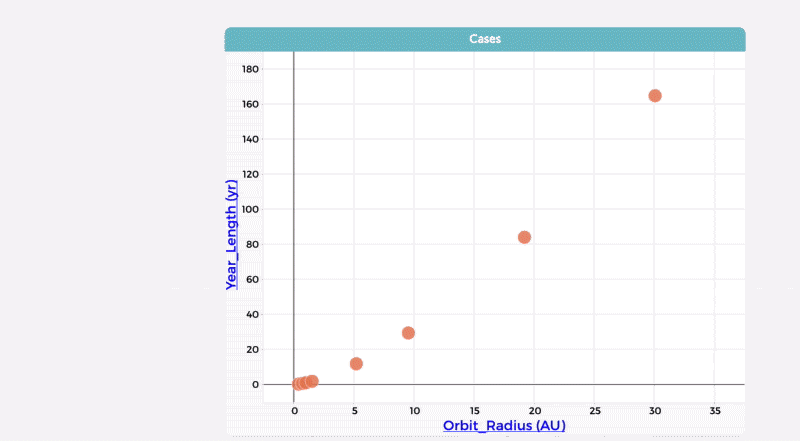
1. Select the graph.
2. Click on the Ruler icon to the right of the graph. Check “Plotted Function.”
3. In the Formula Editor, enter the value of the expression you want to plot. Press the “Apply” button.
Plotted functions can also contain dynamic variables, like sliders, as can be seen below. The function syntax is the same as that used for formulas for attributes, which is described in this help page. See here for a list of all possible functions in CODAP.
