Switch From Table to Case Card View
Data presented in a table in CODAP can also be viewed on case cards. A case card shows all the data for just one individual case (one row in the original table). This can be an especially useful way of looking at the data if there are many attributes in the table. Case card view is compatible with both regular tables as well as nested/heirarchically structured tables.
To switch from case table to case card view, click on the ![]() button in the upper left corner of the table.
button in the upper left corner of the table.
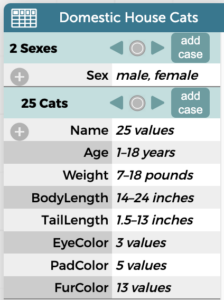
If no cases were selected (highlighted) in the table, you will get a card summarizing the full data in the dataset (see example below). Note that this is a heirarchically structured table, with “Sex” as the top level and all other attributes nested below. If you do not see this summary, you can get to it by clicking on one of the circles in between the triangles.
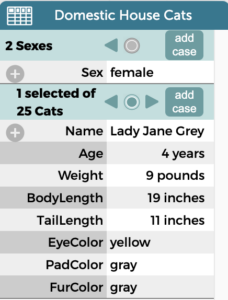
To explore individual cases, click on the arrows/triangles. The case card example below shows the values for all attributes for one particular case in this dataset.
You can add new cases to the dataset while in case card view. To do so, simply click on the “add case” button and write in the attribute values for each new case. You could also add a new attribute to the full dataset by clicking on the plus sign.
Like in table view, you can drag the name of an attribute from a case card to add it to a graph or map in CODAP.
To return to table view, click on the ![]() button in the upper left corner of the case card.
button in the upper left corner of the case card.
The video below also demonstrates how to switch between table and case card view.