Some Ways to Use Formulas with Date Attributes
 You may already know that CODAP includes many different functions to shape data for an investigation including a lot of date functions. Oftentimes, we find that we are given data about dates but need to convert it to different units or break it up into multiple categories to better address date-related questions. Here we lead you through one example in which we explore whether the number of extreme heat days have increased for a particular season or decade. We cannot simply use the date without computing the desired season and decade from it. By applying a few data moves in CODAP such as “dragging left” to group the data and applying formulas to the date attribute we can quickly create new attributes—season and decade to facilitate our data exploration.

You can follow along using this CODAP document: Extreme Heat—Formulas for Date Attributes.
So how exactly can we use formulas to create these new attributes?
- Make a new attribute to hold your calculated values (click on the plus sign on the top right of the table to add a new attribute). An editable column name appears. Let’s first create year attribute by typing in that window.
 Click the attribute name and choose Edit Formula from the drop-down menu. The formula editor appears.
 - Enter the formula “year(date)” in the editor. Voila! Your column labelled “year” will be filled with only the year, extracted from the date values of the attribute. You will notice that this column of values is yellow. To lock these values and turn the column back to white, click the attribute year once more and select Delete Formula (Keeping Values).
 Just as you did with year, create a new attribute called month and open the formula editor window for it so you can type the formula monthName(date) in the formula box. You can also click on the Insert Function button and select “monthName” from the Date/Time function list. With your cursor inside the parentheses, click “Insert Value” and select “date” and then Apply. Now you have a column filled with the name of the month for each date. As you did in the previous step, use the Delete Formula (Keeping Values) menu item.
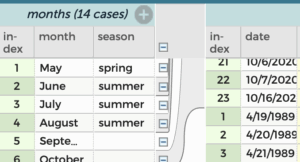 The month attribute enables you to create a season attribute. Drag month to the left of the table. Then, create a new attribute there named season. For each month, type in the season that corresponds to it manually. Drag the month and season attributes back to the right side of the table and note that all 4819 cases will have month and season values.
- We can use a similar technique to count the number of extreme heat days per year. First, ensure that the year is left of the main data table. Then, create a new attribute named count of tMax next to it. For this new attribute, enter the formula “count(tMax)” so that you get
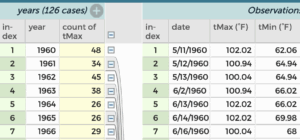 the number of extreme heat values reported for each year.
 - You need one more new attribute: decade. Give it the formula “floor(year/10)*10”. This formula uses the floor function that takes a number like 196.7 and just returns the integer part. Two examples of what this formula are shown below.
floor(1967/10) x 10 = 1960 floor(1982/10) x 10 = 1980
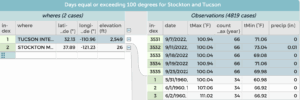
Now that you’ve transformed the data to include new attributes for year, decade, and season, you can investigate how the number of hot days has been changing for the Stockton, CA and Tucson, AZ.
The table below lists and describes the formulas used to create the attributes in this example.
| Formula function | Generic Formula | Formula with this dataset example | Result |
|---|---|---|---|
| Extract the month name from the date string | monthName(attribute) |
monthName(date) |
Turns 5/11/1966 into May |
| Extract the year from the date string | year(attribute) |
year(date) |
Turns 5/11/1966 into 1966 |
| From the data string return a value for the decade the year in from | floor(attribute) |
floor(year/10)*10 |
Turns 5/11/1966 into decade 1960 |
| count | count(expression, filter) |
count(tMAX)Note you must take the year attribute and “drag left” first. Then, create the count tMax(year) attribute and apply this formula to that column. |
Counts the number of extreme heat days per year. |
Leticia Perez, Senior Data Science and Professional Learning Specialist, WestEd
Frieda Reichsman, Senior Researcher, Concord Consortium