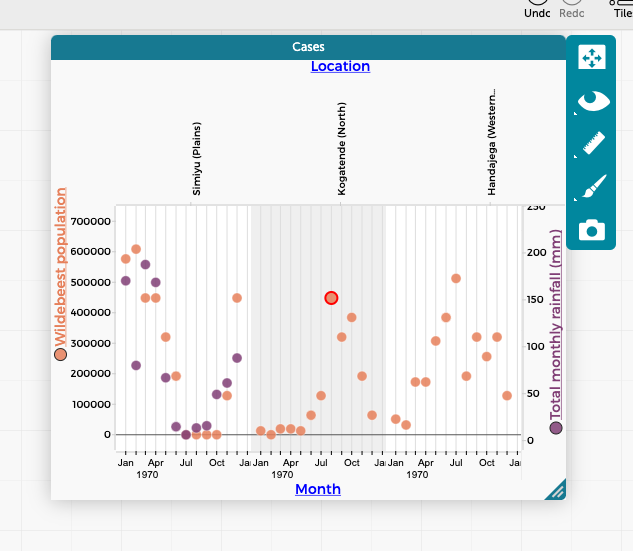
I have a data set with a time variable (month), two numerical variables (population of wildebeest and rainfall) and a categorical variable (location). I want to get 3 side-by-side graphs, one for each location, with time on the X-axis and 2 Y-axes. I find that the order in which I manipulate the graph matters. I get what I want if I plot the X-axis and the 2 Y-axes BEFORE creating the side-by-side graphs with the categorial variable. However, if I plot the X-variable and one Y-variable, then create the side-by-side graphs, then try to add the second Y-variable, I only get points plotted for one of the side-by-side graphs. Screen shot attached. Bug?
 .
.