- This topic has 7 replies, 2 voices, and was last updated 9 months, 1 week ago by
ClaireW.
-
AuthorPosts
-
ClaireW
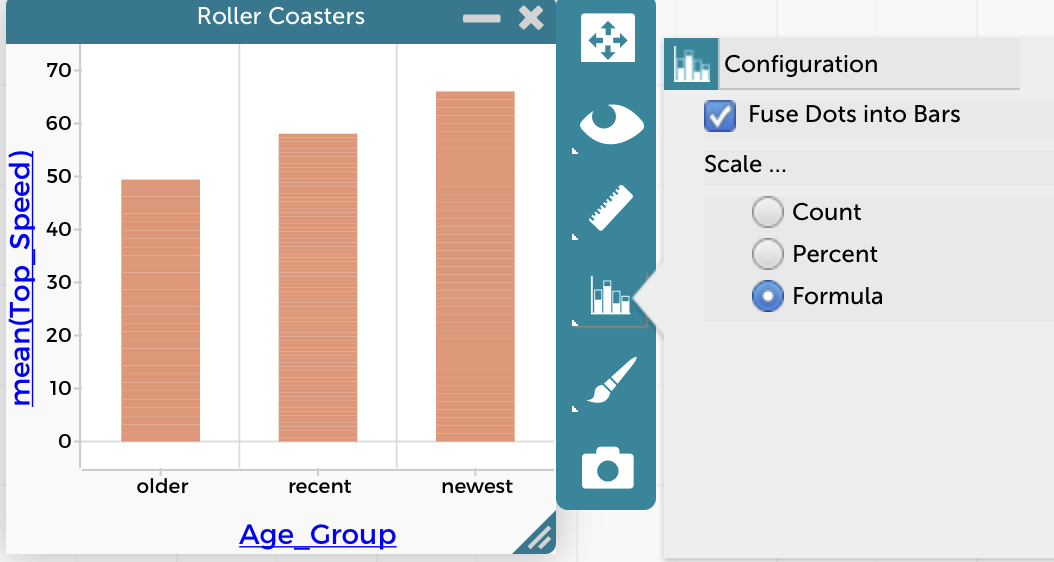
ParticipantHi, I’m trying to have students make bar graphs where the x-axis shows a categorical variable and the y-axis shows the mean of a numerical variable. I know I can get the means to appear as lines over the points, but that’s not exactly a bar graph (and it doesn’t seem possible to change the y-axis to say “Mean of [variable]”). Is there an easy way to do this that I’m missing?
July 12, 2025 at 3:01 pm #12411 Bill FinzerKeymaster
Hi Claire,
It is possible to do. Once you’ve made a bar chart, go to the configuration menu as shown in the screen shot and choose Formula for the Scale. Then you can enter the formula you want and the bars’ heights will be equal to the result of evaluating that formula for each group of cases.
Hope that helps,
Bill
Attachments:
July 12, 2025 at 7:45 pm #12415ParticipantHi Bill,
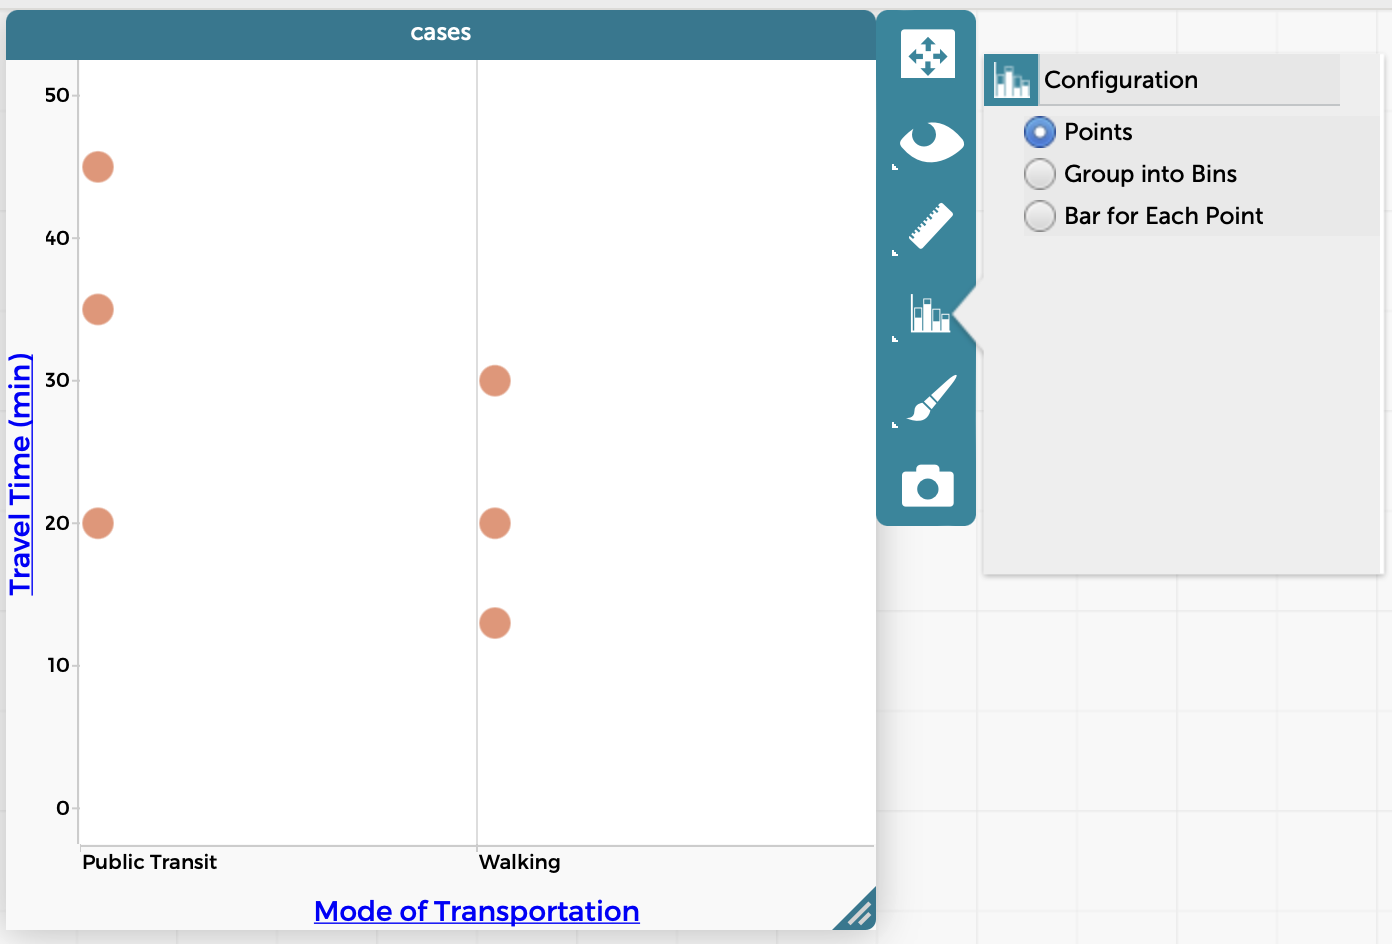
Thanks so much for the quick reply! I’m not seeing that option unfortunately – see screenshot below. I’ve confirmed that the x-axis variable is set to categorical and y-axis variable is set to numeric. What am I doing wrong?
Thanks,
Claire
Attachments:
July 12, 2025 at 8:03 pm #12417Bill FinzerKeymasterHi Claire,
Ah, don’t put the numeric attribute on the y-axis. With the categorical attribute on the x-axis, choose Fuse dots into bars from the Configuration menu. Then, from that same menu, you’ll see the option to set the scale using a formula.
I just found the relevant page in the help system. I bet that will help! 😉
Bill
July 12, 2025 at 8:09 pm #12418ParticipantAhh perfect, thank you, that’s exactly what I was missing!
One more quick question while we’re at it – I don’t suppose it’s possible to add error bars?
July 12, 2025 at 10:50 pm #12421Bill FinzerKeymasterSorry, you’re right. There’s no way to add error bars.
July 12, 2025 at 11:47 pm #12422Bill FinzerKeymasterHi again,
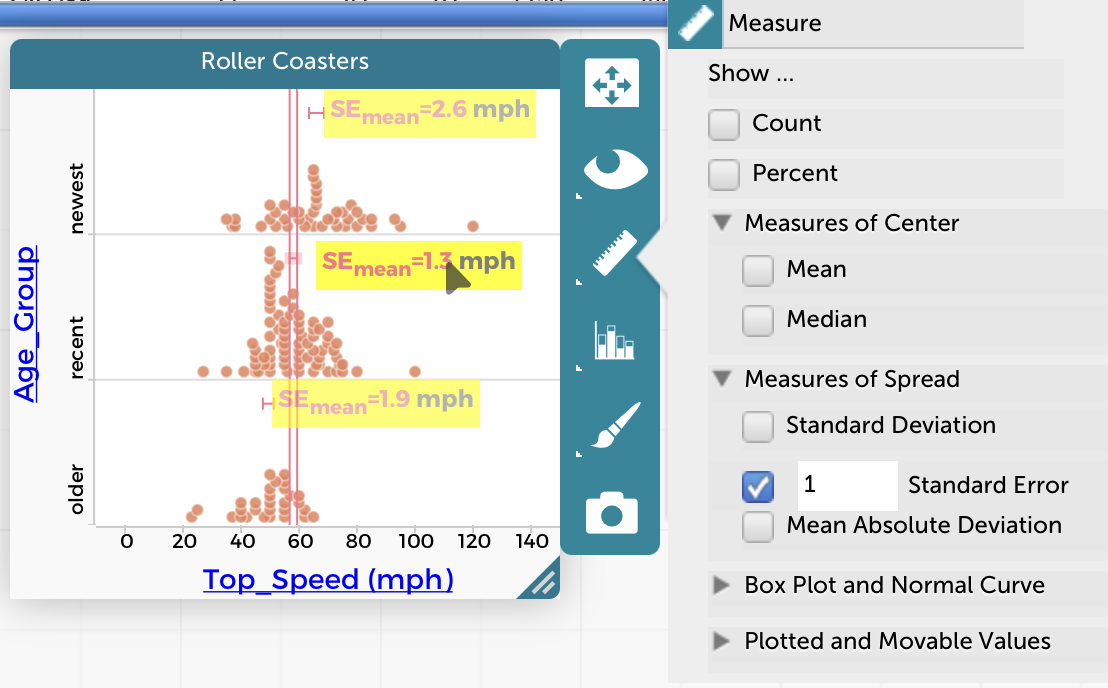
Just in case you aren’t already aware of the ability to show standard errors, check out the enclosed screen capture. Note that hovering over one of the error bars or its label causes lines to extend that make it easy to check for intersections with other error bars.
I know this doesn’t take the place of error bars associated with a bar chart. But maybe it’s better?
Bill
Attachments:
July 13, 2025 at 6:57 pm #12431ParticipantGood to know, thanks – not sure this quite works for my current purposes, but good for the students to play with. Adding error bars to bar charts would be a great feature to consider for the future.
Thanks again for all your help!
-
AuthorPosts
- You must be logged in to reply to this topic.