Kia ora!
I used CODAP during a workshop I ran with teachers today as part of my data science education PhD research. Part way through an activity working with parent/child (hierarchical) tables, my teachers identified a potential issue!
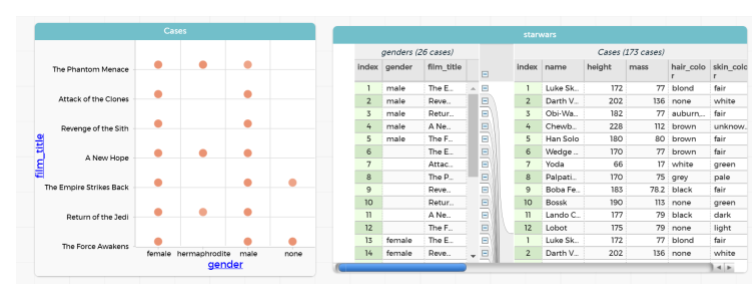
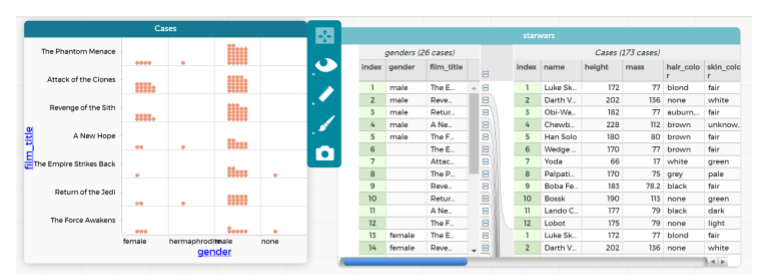
Below are two screenshots where the graph displayed is different even though the structure of the data tables is the same. The issue is related to dragging a variable on/off (?) the parent table to/from the child table.

vs

In between the screenshots shown, the name variable was dragged on to the parent table and then dragged off again.
In my live demo everything worked fine, but the teachers in their own explorations got a little bit stuck. However, to put a positive spin on the experience, it was great that the teachers could spot there was an issue 🙂
Sometimes, if you select a group of points on the graph (or rows in the table) the graph “refreshes” and corrects itself (I’m assuming/hoping correct is the first graph!), other times nothing changes.
Here is a link to a GIF that shows another reproduction of the issue 🙂
https://drive.google.com/open?id=10_XN2lhOz-7C6ETDik2zUvbE7c5HXYTY
I’m using version 2.0 (0444) BTW.
Regards Anna