- This topic has 9 replies, 4 voices, and was last updated 7 years, 8 months ago by
 Bill Finzer.
-
AuthorPosts
-
Jo Louie
ParticipantI’m working with a categorical variable (educational attainment) in which the categories do not sort themselves logically when I drag the variable to an axis on my graph (e.g., “Grade 11” precedes “1 year of college” which precedes “Nursery school” when reading left to right on the x-axis). I see that I can physically drag the categories to create the order I want. However, with many categories, this step is slow and cumbersome. Is there a way to automatically or quickly re-order the categories (such as sequentially or alphabetically)?
September 13, 2018 at 10:31 pm #711Bill FinzerKeymasterHi Jo,
Good question!
The very first time you use a categorical attribute in a graph, it will be ordered alphabetically. After that, there is no automatic way to resort the categories, so you have to do it by hand. The ordering of the categories becomes part of the attribute itself.
Bill
September 14, 2018 at 4:38 pm #714Bill –
Does this meant that the ordering is “fixed” after you drag the attributes into the other you want? So that the next time you used that variable, the categories would have the new order?
September 14, 2018 at 7:08 pm #715Bill FinzerKeymasterHi Andee,
Yes, that’s correct, the new order will apply everywhere from then on (until you change it again). In fact, if you have two graphs that use the same categorical attribute and you reorder in one you will see the reordering take place dynamically in the other as well.
Bill
September 14, 2018 at 7:12 pm #716I didn’t know that – good news!
September 18, 2018 at 5:56 pm #717Anonymous
InactiveSo I re-ordered each categorical variable from our Data Clubs database on teens and technology to go from least to most when such an ordering makes sense. For example, one survey question asks about how often teens use the internet and their responses range from seldom, to several times a month, to weekly, to several times a week, to daily, to several times a day, to nearly constantly. I placed variables like this in graphs and re-ordered the responses so that they would go from least often to most often. Then I re-saved my database.
Later, when returning to the database and dropping variables like this on the X axis, everything is great. The lowest value (e.g., “seldom”) is closest to the origin and the highest value (e.g., “constant”) is further from the origin. However, if I drop the same variable on the Y axis, the ordering is reversed, with the highest value closer to the origin and the lowest value further away from the origin. The order is right, but it just goes in the wrong direction.
If the variable is numeric this does not happen. Age, for example, goes from lower to higher as expected whether you drop it on the X or Y axis. Lowest values are always closer to the origin with the numeric data.
Some variables can be treated as categorical or numeric. For example, there is a survey question about number followers on Instagram. As a default the variable was treated as categorical because it includes the response, “not sure”, but it also includes numeric values. When this variable is dropped on the Y axis and treated as categorical, the responses go from highest to lowest starting at the origin, but if treated as numeric, they go in the reverse direction, from lowest to highest, starting at the origin.
I’m not sure why the Y axis shifts the direction of the the order of values depending on whether a variable is treated as categorical versus numeric. It makes the graphs with categorical data that has some intuitive directionality hard to read. The responses are ordered correctly, but they reverse the direction that I want. Am I doing something wrong? Is there a way to work around this?
September 18, 2018 at 7:57 pm #720Bill FinzerKeymasterHi Traci,
Thanks for your thoughtful response. I can supply the reasoning by which we came to the decision to order a categorical y-axis from “low” to “high” starting at the top instead of the bottom.
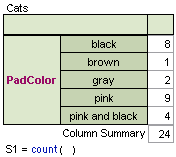
It came about 15 years or so ago working on Fathom, CODAP’s predecessor. In Fathom there is a summary table that lists an attribute’s categories as shown in the accompanying screenshot. In the table, it made sense, if there were an ordinality to the categories to list them from top to bottom. Having a different order when the categories were listed on the y-axis was untenable.
In CODAP we don’t (yet) have a summary table. But I think an argument can still be made for the current behavior in that we read (at least in English) from left to right and then from top to bottom. We can view the categories listed on the y-axis as a list, and, in fact, making such a graph is a useful way to view all the categories (provided there aren’t way too many!).
So that’s the story of why categories are ordered left to right or top to bottom. Numerical axes have an origin at the lower left.
I welcome comments from other participants in this forum.
Bill
Attachments:
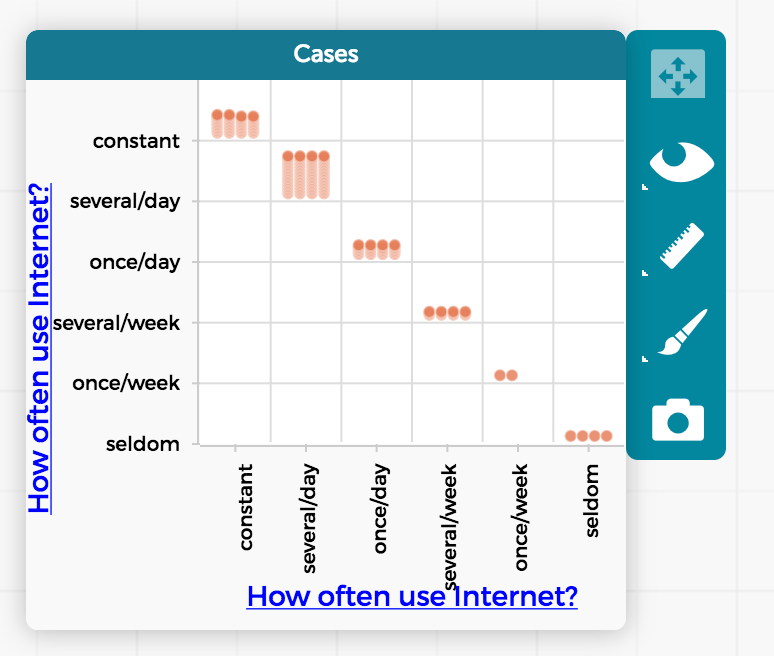
September 26, 2018 at 1:13 am #722I’d like to weigh in on this, since I actually disagree with the decision – and didn’t realize that Fathom did it this way, either. I think there should be consistency in how we think about the Y-axis and it should ALWAYS be that lower values are further down. If not, we get the attached counter-intuitive graph, in which a “perfect” correlation is represented as a line with slope -1, rather than 1. This seems wrong to me.
Attachments:
September 28, 2018 at 12:52 pm #742InactiveI fully agree with Andee. It really makes visualization confusing and teaches the wrong instincts about the slope of the line. Graphs and text are read in very different ways. How data is organized should be consistent (whether it is categorical or numeric, especially if the categories have some level of magnitude) and it should work with conventions used in graph reading rather than text reading when there is a conflict between the two. And on a minor note, if you switch back and forth between treating an attribute as numeric or categorical (we actually have some texting data that you might want to consider doing this with) your graph completely changes, which really feels nonsensical.
September 28, 2018 at 3:01 pm #743Bill FinzerKeymasterHi Andee and Traci,
You’re definitely making me reconsider the design decision to list categories on the y-axis from top to bottom. Traci’s example of the “nonsensical” behavior of the reordering that occurs when switching back and forth from numeric to categorical is particularly persuasive. Also, I have to remind myself that the decision in Fathom was based on the presence of a summary table, which we do not have in CODAP.
So I’ll post the story in Pivotal Tracker, our bug and feature tracking system.
Thanks for your thoughts!
Bill
-
AuthorPosts
- You must be logged in to reply to this topic.