two box plots on same axis to compare

CODAP Forums CODAP Help Forum two box plots on same axis to compare

Viewing 2 posts - 1 through 2 (of 2 total)
  • Author
    Posts
  • #477 Score: 0
    Kathleen Ilaoro
    Participant

    How do I create 2 box plots on the same axis so that I can compare before and after data?

    #478
    Bill Finzer
    Keymaster

    Hello Kathleen,

    The trick here is to structure your data in a way that CODAP can use to display multiple box plots.

    So, if you have an attribute for, let’s say Group, and another, let’s call it Measurement, your data might look like this:

    Group     Measurement
    before             7
    after                5
    before             10
    after                9
    etc.

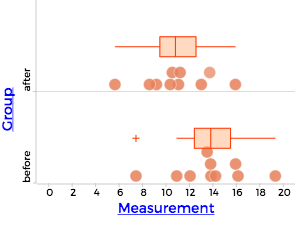
    The you put Measurement on one axis, and Group on the other.

    Finally, in the Ruler menu for the graph click on the checkbox for Box Plot.

    See the enclosed screenshot.

    Hope this helps,

    Bill

    Attachments:
Viewing 2 posts - 1 through 2 (of 2 total)
  • You must be logged in to reply to this topic.