Good to know, thanks – not sure this quite works for my current purposes, but good for the students to play with. Adding error bars to bar charts would be a great feature to consider for the future.
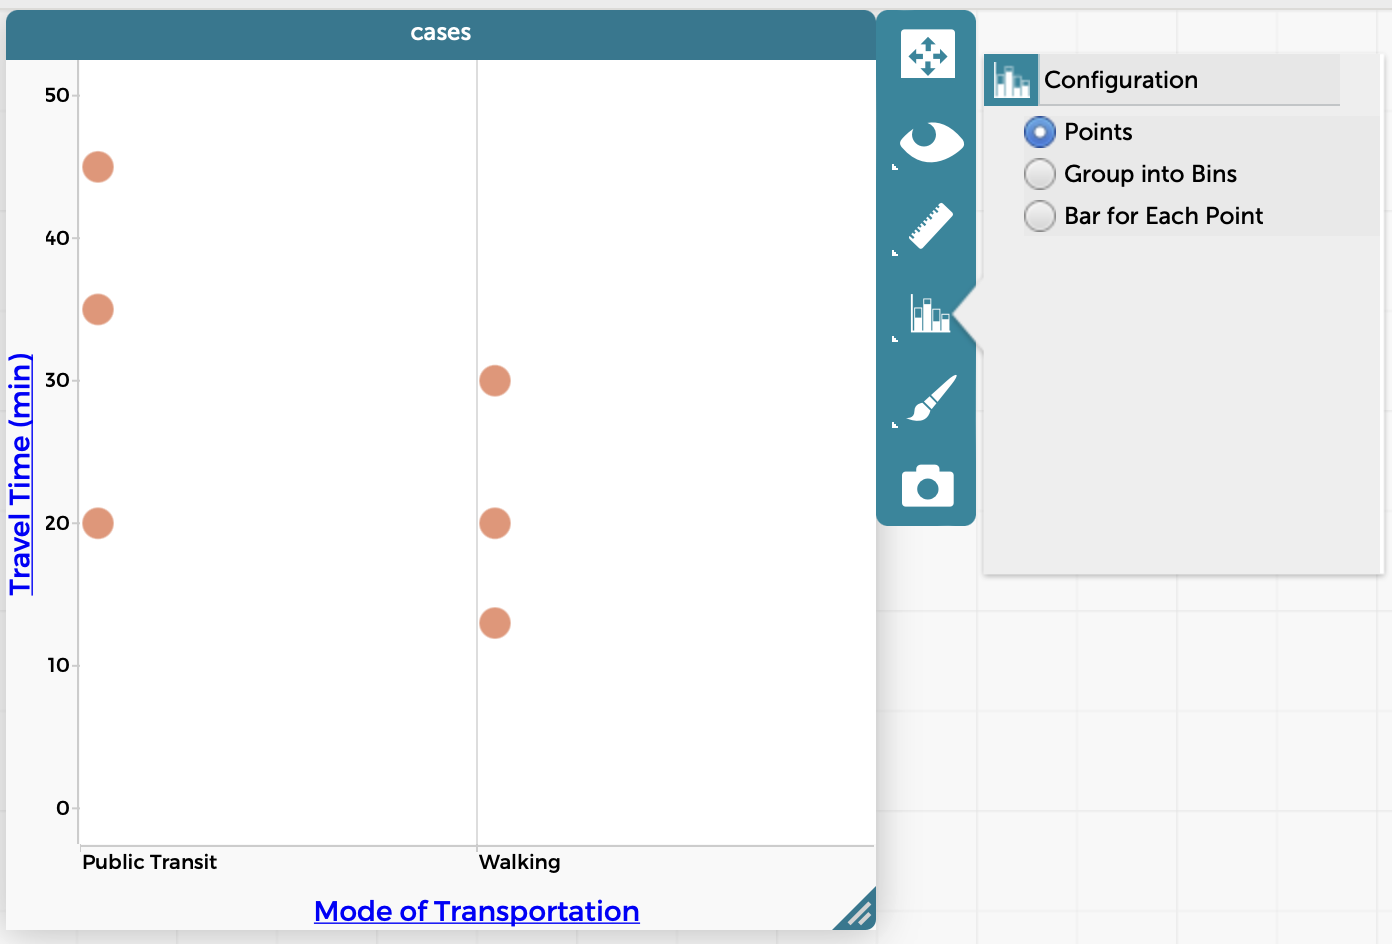
Thanks so much for the quick reply! I’m not seeing that option unfortunately – see screenshot below. I’ve confirmed that the x-axis variable is set to categorical and y-axis variable is set to numeric. What am I doing wrong?