Built-In Plugins in CODAP
CODAP has several built-in plugins that you can access directly from the toolbar at the top of any CODAP document. To access these built-in plugins, click on the “Plugins” icon, then select the plugin from the list that you wish to open (see images below). The plugins are categorized into different types/submenus, as shown below.
Note: Many additional plugins can be found in our CODAP plugins database, and you can read more about how to use these additional plugins here. It is possible to create your own CODAP plugin by following these instructions.

Below are brief descriptions of how to use these built-in plugins in CODAP. Many CODAP plugins also contain information about how to use them inside the plugin, typically accessible by clicking on an icon such as (i) or (?) or on text such as “About.”
Story telling
Draw Tool
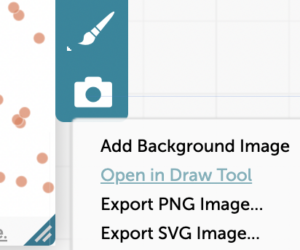
As its name suggests, the Draw Tool plugin allows you to create your own drawings/other annotations in CODAP. You can then export these drawings/annotations as image files by clicking on the camera icon within the Draw Tool plugin. Note that if you have created a graph in CODAP, you can click on the camera icon in the inspector palette to the right of the graph and select “Open in Draw Tool” (see screenshot below). This will create a screenshot of your graph and open it in the Draw Tool plugin, where you can then draw on/annotate the image of your graph.

Sonify
With the Sonify plugin, you can play your data as sound, with higher pitches representing higher values and lower pitches representing lower values for an attribute. The plugin is intended to be used with time-series data. It enables you to pick among the tables you have in CODAP (“Select a Dataset”–see image below, middle panel), then select an attribute to map to time, plus an attribute for pitch. Once you have made your selections, click on “create graph” to create a graph with the selected data/attributes. Click on the triangle to the right of “Play/Pause” to play the sonified version of the graph (to pause, click on the triangle while playing–and to play from where you paused, click on the triangle again). Click on the icon to the right of “Reset” to go back to the beginning of the graph. Clicking on the circle to the right of “Loop” will make it so the sonification plays repeatedly when you click “Play.” You may also drag the circle for “Speed” to the left to slow down how fast the sonification plays, or drag it to the right to speed up play. By default, Sonify plays each data point separately as discrete/separate pitches. If you would like to hear the sonification slide between data points, drag the circle for “Smooth sound” to the right (you could think of this as the sonic equivalent of adding a connecting line to a graph). Note that the plugin will play sounds reflecting the selections in the Sonify box, even if you have no graph made in CODAP or a graph showing different data/attributes than those selected in the plugin. A best practice is to only have one graph open at a time, created via the Sonify plugin by clicking “create graph.” Sonify can also play more than one sound at the same time. For example, if the graph below had no data selected, or all of the data selected, Sonify would play both daily and total infections at the same time. If you only want to hear just one series/line on the graph, you need to select the cases for that series in the table or in the graph, as shown in the example below. If any cases are selected, Sonify plays sounds for the selected cases only.
Story Builder
Story Builder is a plugin that enables telling a story in CODAP, going from one step, or “moment,” of the story to the next, seeing CODAP in a different, preset state/configuration for each “moment.” You could think of Story Builder as a cross between CODAP and a slideshow, but note that unlike a static slideshow, for each “moment” of the story, CODAP remains interactive, so a user could modify the graphs/tables/maps etc. as they wish. The Story Builder help page describes the basic components of the plugin and includes a five-minute video tutorial showing an example of how to create a story.
Getting data
Microdata Portal
With this plugin you can retrieve a random sample of data drawn from the United States decennial census and the American Community Survey. You can select data from 12 different years spread between 1860 and 2017 and you can choose from attributes including demographic information, income, employment, and geography. Each case/row represents one unique person. You can select a random sample of up to 1,000 people.
NOAA Weather
This plugin allows you to collect historical weather data from weather stations around the US. To select a station/location, start typing in the city/town of interest underneath “Location.” Click on the city/state name of interest in the drop down list that appears. You could also click on “use current location” at the top of the drop down list that appears under “Location” to find the closest station to you (if your browser can access your location), or click on the map icon to find weather stations on a map of the US (double click on a weather station on the map to select it). When a station is selected, its name appears to the right of “Location.” You can then specify a “Date Range” of interest, whether you want to look at monthly, daily, or hourly weather data, whether you want to use metric or standard units, and which specific weather attributes you want to see (such as minimum temperature, maximum temperature, precipitation, etc.). Once you have specified the data you want, click on “Get Data” to produce a table with this data in CODAP. Note that some weather stations are no longer active. When you enter in a start and end date, below the calendar there will be an indication of the date range for which data is available for the weather station in quesion. If you select a date range that goes beyond the range of dates with available data, you will be unable to click “Get Data.” Also, if you display the map, currently inactive stations are indicated in gray coloring and a “false” value for the “isActive” attribute (active stations are indicated with blue coloring and a “true” value for the “isActive attribute).
Simulation
Sampler
The Sampler plugin is used for selecting random samples, either as a simulation or from a dataset in CODAP. You can specify how many items to collect, as well as how many samples. This video tutorial illustrates the basics of how to use the Sampler plugin to collect/produce random samples in CODAP.
Data moves
Choosy
Choosy is a plugin that allows you to quickly hide or show attributes in a dataset as well as add a tag to selected cases that can then be used in filtering the dataset. If you have multiple datasets/tables in CODAP, use the “dataset” tab in the Choosy plugin to select which dataset you want to work with. To hide or show attributes in the dataset, click on the “attributes” tab in the Choosy plugin and use the sliders. Green means the attribute is visible; gray means it is hidden. To add a new attribute with a tag to the dataset, click on the “tag cases” tab. You can tag all selected cases with a specified value (“simple” tag), tag selected cases with one value and unselected cases with a different value (“binary” tag), or randomly put a specified proportion of cases under one tag value with the rest under another value (“random” tag). Tag values can be numeric or text. Tags can be used to quickly filter the dataset, for example, by dragging the tag to the left of the table to create a new level and then setting aside cases with a specific value for that tag. See here for more details on how to use Choosy.
Transformers
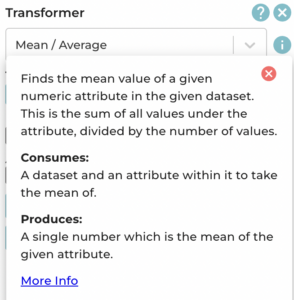
The Transformers plugin allows you to transform datasets to produce new, distinct output datasets or values instead of modifying the original dataset itself (i.e., the plugin will produce a new table/value without modifying the original table). This enables easy “what if” exploration and comparison of datasets. This could include things such as transforming an attribute (e.g., change Celsius to Fahrenheit), exploring a new calculated attribute such as a running sum, sorting the data, and more. To learn more about what a specific Transformer does, select it from the drop down menu and then click the “i” icon to the right of the menu (see example in screenshot below). There is also additional documentation of the Transformers plugin here.

Statistical inference
Scrambler
The scrambler plugin creates a sampling distribution from some measure to test out the broader application of a hypothesis. For example, could a difference in the mean between two groups in a dataset, such as the mean height of men versus the mean height of women, be due simply to chance? You could use scrambler to randomly assign the height data to two different groups, doing this scrambling procedure multiple times to generate multiple observations of differences in the means between two randomly selected scrambled groups. Then, you could compare how the actual difference in the mean height for men vs. women compares to the distribution of differences in mean heights between two groups when the data is randomly scrambled. If the actual difference in mean height between men and women is greater or less than the vast majority of the differences in means generated from scrambled data, it is unlikely that the actual difference is due to chance. To see a more detailed example of such a comparison performed using the scrambler plugin, visit the scrambler guide.
Testimate
Testimate is a plugin that enables you to perform statistical tests/estimates in CODAP. These include difference of means by group (t-test), goodness of fit (chi square), proportion tests, test of independence (chi square), and logistic regression. For more information on what you can do with the testimate plugin, visit the testimate guide here.
Note: Many additional plugins can be found in our CODAP plugins database, and you can read more about how to use these additional plugins here. It is possible to create your own CODAP plugin by following these instructions.