Creating multiple plots from a set of data

CODAP Forums CODAP Help Forum Creating multiple plots from a set of data

Viewing 3 posts - 1 through 3 (of 3 total)
  • Author
    Posts
  • #7889 Score: 0

    I tried looking for this on the forum and didn’t see it. I also tried navigating through the help section and the settings but to no avail.

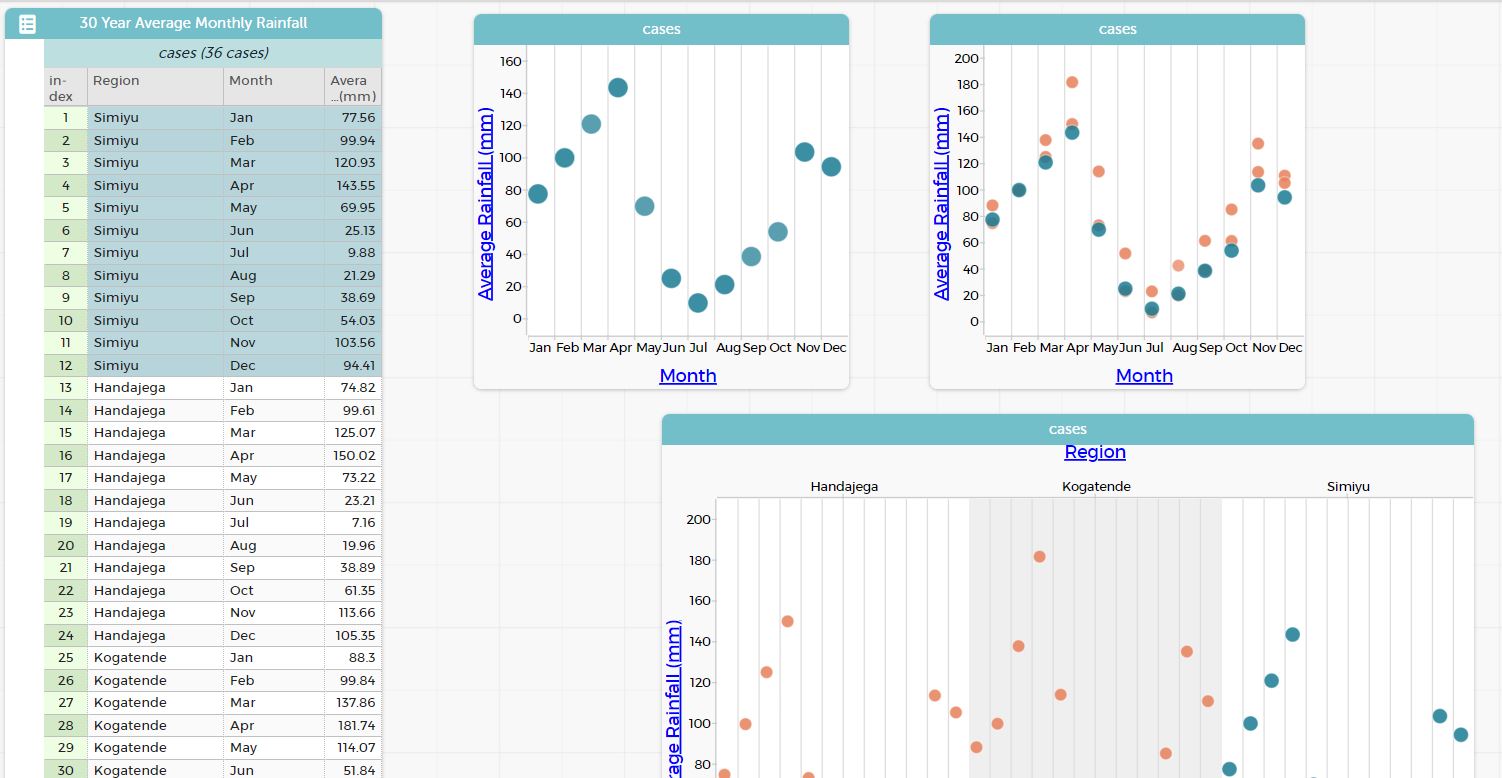
    If I have a data set that include multiple regions or categories of data (e.g. location 1, 2, and 3), how do I create three unique graphs that isolate each subset of data.

    I figured out how to include and separate them all on the same graph, and I figured out how to hide/show only selected. But If I have three categories, how does that work? Is it possible?

    My goal is to create three distinct plots.

    Thanks in advance.

    Attachments:
    #7891
    Bill Finzer
    Keymaster

    Hello,

    I think I understand what you wish to accomplish. Here is one way:

    1. Make a graph of Average Rainfall versus Month.
    2. Drop Region into the middle of the graph so that it becomes a legend.
    3. Click on the legend key for the region you would like to show in the plot.
    4. Click on the “eyeball” menu icon in the graph’s inspector pane and choose Hide Unselected Cases.

    The result is a graph that shows only one region’s worth of data. Repeat for the other two regions.

    I notice that you have discovered how to split a graph by Region. Out of curiosity, how does that not serve the purpose you have in mind?

    Did that help?

    Bill

    #7892

    The combined graph does serve the same purpose; however, I was just curious as to if there was a way generate 3 distinct graphs using the dataset for future reference.

    The steps you outlined worked perfectly. Thank you for your help and your time!

Viewing 3 posts - 1 through 3 (of 3 total)
  • You must be logged in to reply to this topic.