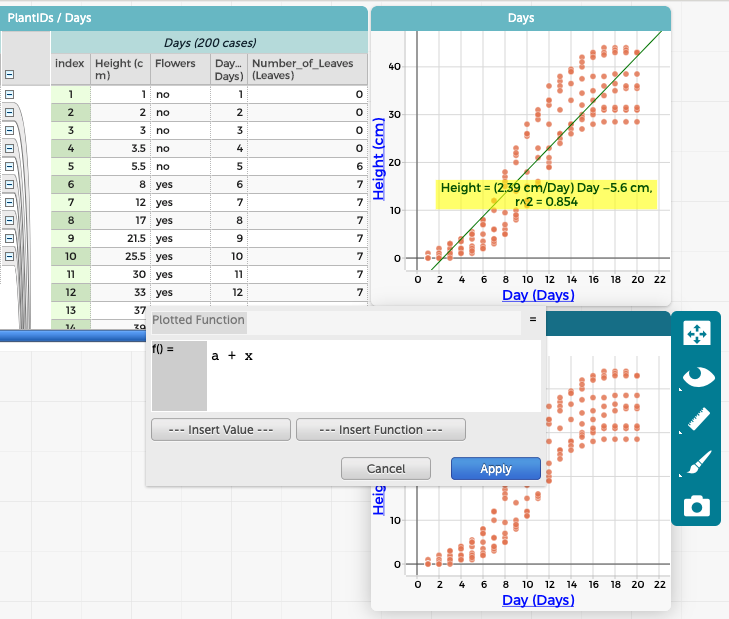
Hi, I have a (possibly embarrassingly simple) question. How can I reproduce the line that I added to a graph using as a least squares lines with a plotted function? I am asking in part because I want to better understand how to plot other functions, i.e., one that will fit this data well! I tried:
f() = b + x
f() = x
But, these didn’t seem to do the trick. Thank you.
Is it possible (or on the docket) to facilitate adding a line of best fit that uses a function other than a linear model (i.e., could you fit a quadratic function)?
It is possible, of course to add quadratic fitting. That starts us down a slippery slope, though, that includes polynomial fitting and exponential/logarithmic fitting. All that functionality can be pretty off-putting to non-math-geeks. So we’d have to figure out how to provide it without cluttering things up. Maybe in a plugin?!
.