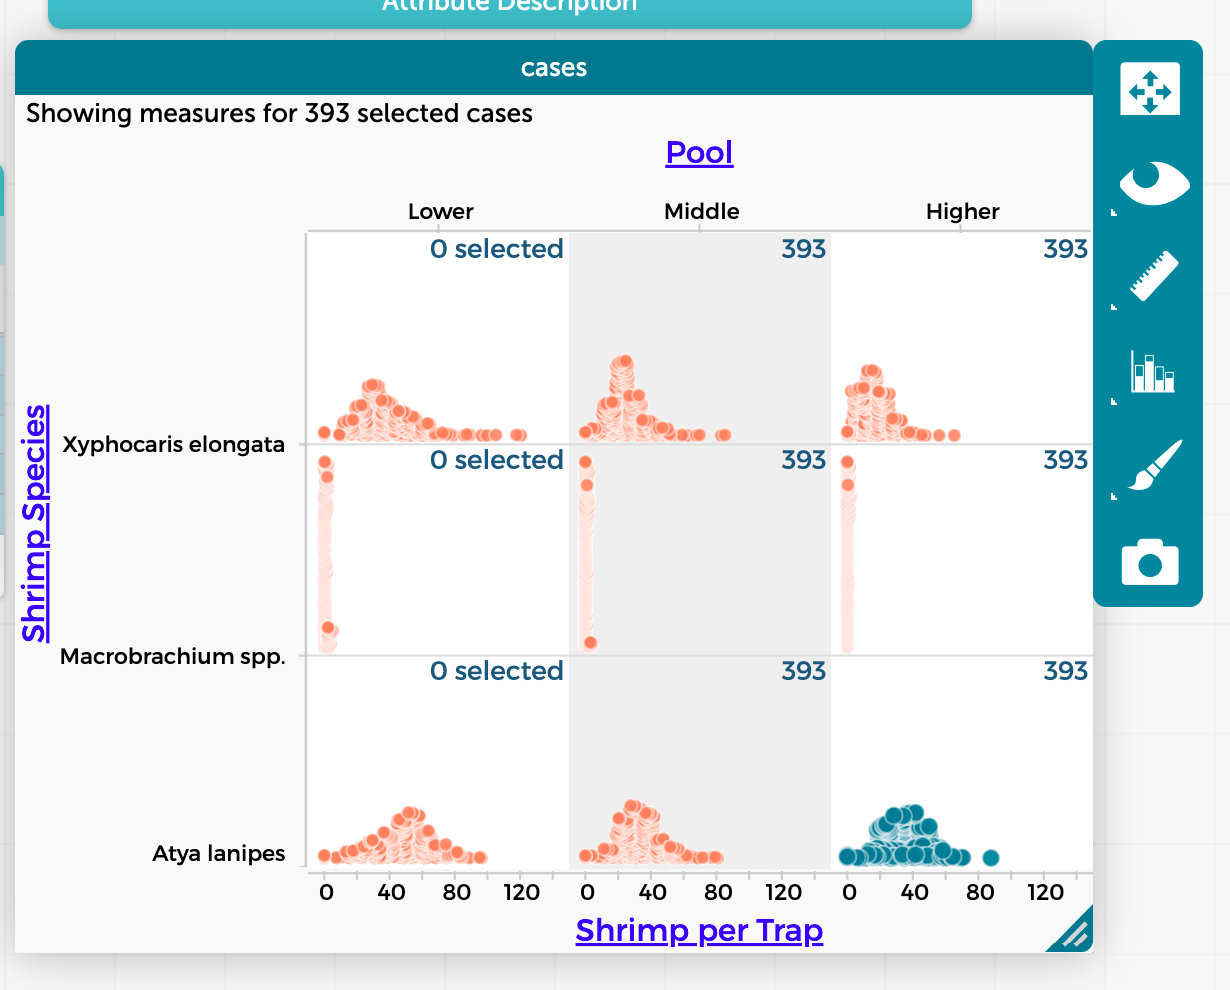
I have a dataset of 3500 cases, with two categorical variables of 3 levels each. I create a 3 X 3 matrix of distributions. Then I select all the points in one of the 9 squares. Then I choose “show measures for selection.” I expect to see 393 in that one square and 0 in all the rest. But I see something else – see attached. Is this a bug or do I not understand what “show measures for selection” is doing? (I do know that this move doesn’t tell me anything new – but I’m still curious why it tells me what it does… It look to me like it’s just looking at one of the two categorical variables in considering the selection.)
Definitely a bug. Your expectation is the correct one. But the Measures for Selection option is only applying to the leftmost column and not being applied to all the subplots as it should be.
.