- This topic has 2 replies, 2 voices, and was last updated 7 years ago by
zanoccoc@oregonstate.edu.
-
AuthorPosts
-
zanoccoc@oregonstate.edu
ParticipantHello!
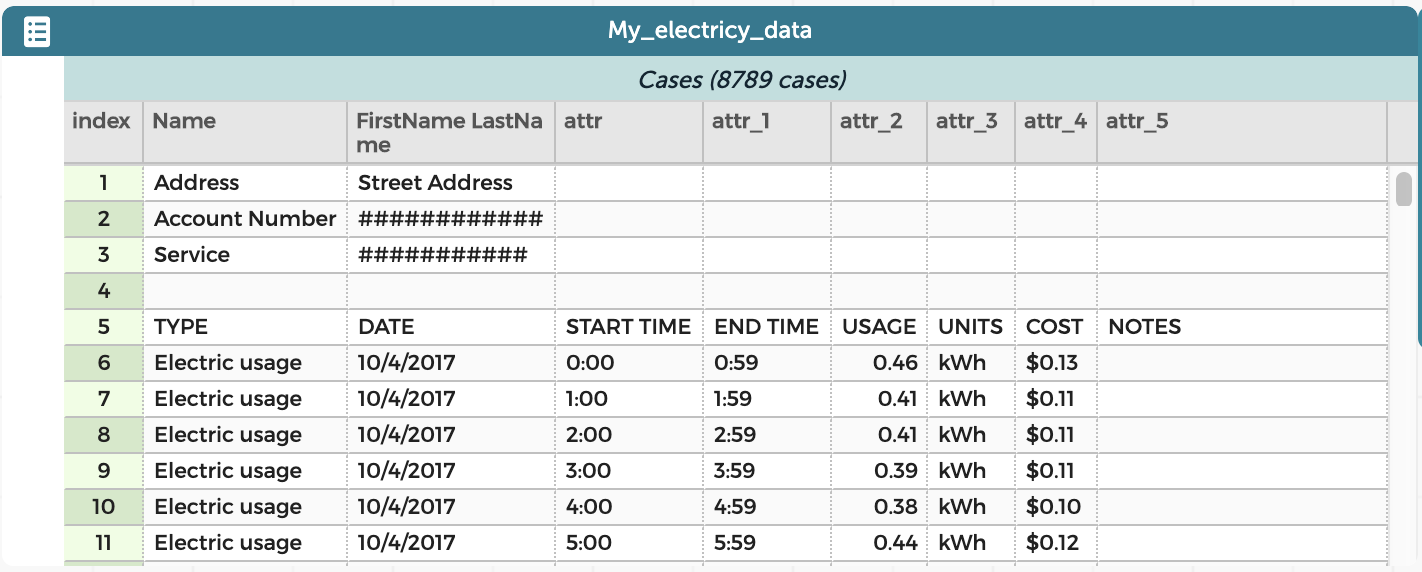
I’m hoping to use CODAP as part of a home energy workshop where teens download a year’s worth of their household’s electricity usage data from their utility provider (as a .csv file) and then “drag” this data into CODAP for visualization/analysis. This utility provider typically reports usage data per hour (recorded via smart meter). For example, a year’s worth of data contains 8760 rows (365 days x 24 hours) with the attributes “DATE” (mm/dd/yyyy), “USAGE” (kWh), “COST” ($), and “START TIME” (Hours:Minutes, e.g. 14:00). See “Example_smart_meter_data.csv” for a sample of this data.
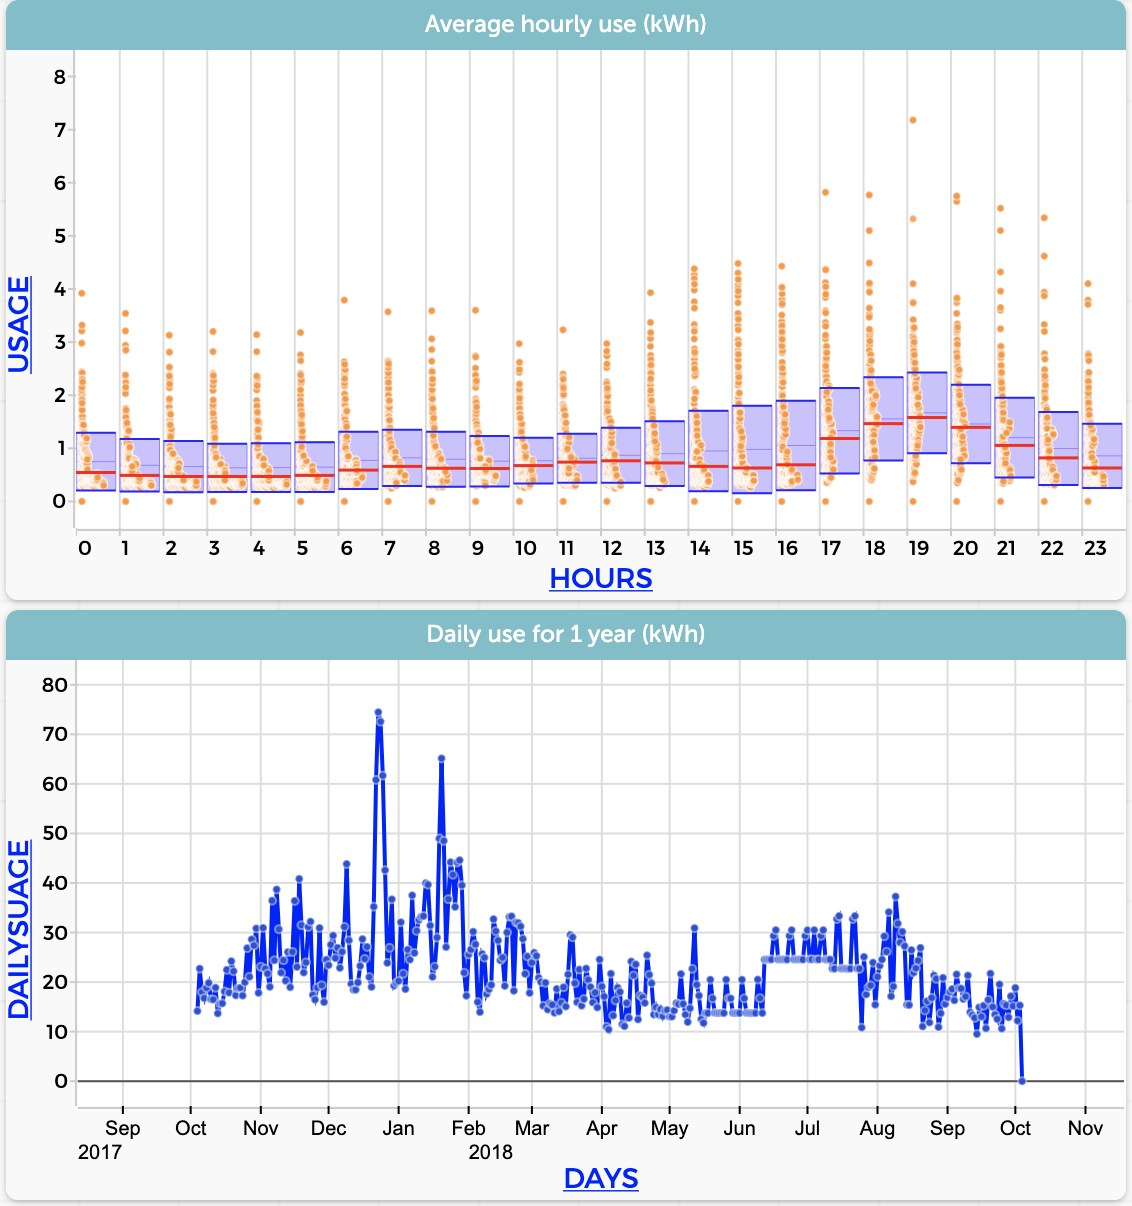
When the .csv file provided by the utility is “dragged” into CODAP, however, it requires cleaning (see attached “uploaded_smart_meter_data.png”). From my limited knowledge of CODAP, it seems that header rows need to be deleted manually and attributes renamed/edited. Additionally, the “START TIME” attribute doesn’t appear to be formattable using CODAP’s day/time functions, so I’ve had to do some string manipulation to get to a data type appropriate for visualization (e.g., HOURS=replaceString(string(STARTTIME),”:00″,””). After a considerable amount of data manipulation in CODAP I can generate visualizations (see attached “visualized_smart_meter_data.png“) but this process is likely too involved for our participants to do on their own data in a workshop setting.
Are there any recommendations for streamlining this process to avoid all these data manipulation steps? Or perhaps just a way to better handle time data in an Hours:Minutes format? Any feedback is greatly appreciated.
Best,
Chad
April 15, 2019 at 8:12 pm #881 Bill FinzerKeymaster
Hello Chad,
Thank you for posting this question, especially as I imagine quite a number of those who wish to use CODAP with real data find themselves in similar situations.
One very incidental help is an improvement to your formula for HOURS. I suggest “HOURS=split(Start_Time, “:”, 1)” which will grab the first item in a list delimited by the colon.
As you may know, you can create a CODAP “plugin” that massages the data. You can learn about these in this Getting Started Guide. But, of course, you have to know a bit of JavaScript to create a plugin.
Another approach might be to automate the preparation of the data using something like Excel Macros. If you aren’t able to do this yourself, perhaps you can find a spreadsheet guru who could whip something up. I think the end result would allow students to quickly transform their csv into something ready to drop in and use in CODAP.
Bill
April 16, 2019 at 8:51 am #883ParticipantHi Bill,
Thanks for your response, this is very helpful. I just applied your suggested formula. We already have some scripts in R that automatically transforms participant data for immediate analysis. However, our hope was to only use CODAP so participants could potentially work with their data outside the workshop and run visualizations on new downloads without us needing to clean it first. We will look into writing a plugin–there are members of our team with this sort of expertise.
Thanks again for your help!
Best,
Chad
-
AuthorPosts
- You must be logged in to reply to this topic.