Forum Replies Created
-
AuthorPosts
-
June 7, 2021 at 11:49 pm in reply to: Issue Creating and Updating Text Views through Data Interactive API #6481
 Bill FinzerKeymaster
Hi Jason,
Unfortunately the text API expects an object rather than simply a string. (Probably we should extend it to simply deal nicely with a string, too.)
Here’s an example of a simple (sic) such object:
{ "object": "value", "document": { "children": [ { "type": "paragraph", "children": [ { "text":This is where selected </span>${<span style="font-style: italic;">pluralize</span>(<span style="color: #000080; font-weight: bold;">this</span>.<span style="color: #660e7a; font-weight: bold;">targetAttributeName</span>)}<span style="color: #008000; font-weight: bold;"> appear.} ] } ], "objTypes": { "paragraph": "block" } } }You can discern the object format at this Storybook site. I hope that helps.
Bill
Bill FinzerKeymasterHi Andee,
There is a way to change the display in the case table or card however. Bring up Attribute Properties, change the type to date and then set the precision to what you want, in this case month.
Hope that helps.
Bill
Bill FinzerKeymasterSegún tengo entendido, puede crear un componente de texto, pero solo puede ingresar un solo carácter. No hemos oído hablar de este problema antes. ¿Qué tipo de computadora estás usando y qué navegador web?
Bill FinzerKeymasterHi Seth,
No, there isn’t. It would be a fairly straightforward plugin to create, but none of our collaborators have prioritized (or even requested) it. You can copy data from a spreadsheet and paste into CODAP using the Import Data from Clipboard command on a case table’s or case card’s ruler menu.
Got any programmer students up for a challenge?
Thanks for the question,
Bill
Bill FinzerKeymasterHello and thanks for reporting this problem. I was able to reproduce the error and we should be able to fix it soon.
I’ll also log your request for the ability to change the count scale to a relative frequency scale. This is not something currently possible in CODAP.
Bill
Bill FinzerKeymasterHi Chris,
Do you have any reason to suspect bandwidth/connectivity issues?
Bill
Bill FinzerKeymasterHi Ryan,
Unfortunately there is no direct control over size of sectors in the spinner. The size of a sector is determined by the number of items (as seen in the mixer) that have a given name. So, if you are looking at a spinner and click the ‘+’ icon this adds a new sector. Change its name to be the same as one of the existing sectors and that increases the size of that sector.
Bill FinzerKeymasterHi,
Can you be more specific? Is the trouble with example/sample docs, a document you’ve save locally, a document saved on Google Drive? What steps lead to the problem? What exactly happens?
Bill
Bill FinzerKeymasterHello,
Thanks for the questions.
- There is no way to import multiple sheets from excel at the same time. If you use Numbers instead of Excel, there is a shortcut for doing the importing that you may find helpful. Select the cells in a given sheet. Press the mouse down and, after a brief pause, drag from Numbers into the CODAP document and release. This is supposed to work in Excel, but I tried just now with Excel on my Mac and couldn’t get it to work. If you’re using Excel on Windows you may have better luck. If so, then this at least eliminates the exporting step.
- Regarding interpolation, CODAP doesn’t have a particular function for this. But I could imagine cobbling something together making use of the prev and next functions as in
if(value=””,(prev(value)+next(value))/2, value)
but that’s certainly not very general purpose.
Bill
Bill FinzerKeymasterHello Susanne,
That’s a lot of attributes, so it makes sense you want students to delete them. Deleting each one separately is the most straightforward way to do this within CODAP. You, and they, may find it a bit easier to use the case card instead of the case table.
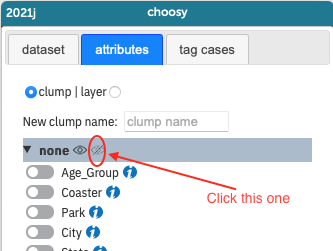
As an alternative, import the Choosy plugin into the document containing the data using this url: https://codap.xyz/plugins/choosy/
Go to the Attributes tab of Choosy and in the gray stripe next to none press the closed eye to hide all the attributes. (See image below.) Then click the slider next to each of the attributes you wish to keep. Voilá, you’re done and can close Choosy.
The downside of this method is that the data values of all the hidden attributes are still present in the document, just hidden. This means that the document isn’t any smaller than when you started, in contrast to the first method.
Hope this helps,
Bill
Attachments:
Bill FinzerKeymasterPara ver el menú más largo, debe arrastrar uno de los nombres de columna (atributos) a un eje del gráfico.
Bill FinzerKeymasterHi Andee,
Nope. Keep these questions coming!
- There is no interface for setting axis limits other than dragging. Sorry.
- There is also no way to prevent CODAP from changing the axis limits when the user does certain things. In Fathom there is a way to link the axes of two or more graphs together, but we haven’t implemented that in CODAP.
The screenshot didn’t make it for some reason. But placement of the zero can be finicky because if an axis limit is zero we want the zero to display even though there is an implementation detail that gets in the way of proper placement.
Bill
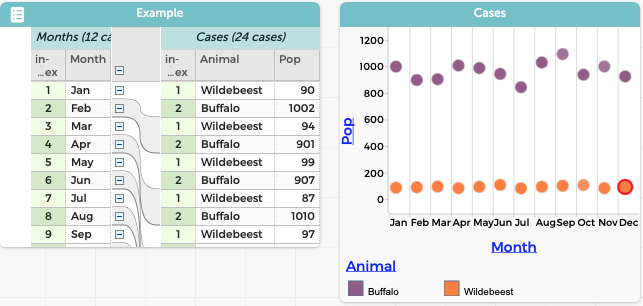
Bill FinzerKeymasterThe screenshot shows how to structure data so that you can get more than one “set” of values on the y-axis with a categorical attribute on the x-axis.
Here is a link to that example document.
Hope this helps,
Bill
Attachments:
Bill FinzerKeymasterHi Andee,
CODAP supports multiple y-axis attributes for scatterplots because it is such a common use case. While I’m sure there a many situations like the one you put forward where it would be useful they just don’t come up among our audience. (You’re the first.)
Incidentally, I couldn’t resist creating this (unsatisfactory) workaround by superimposing two graphs, the top one with a transparent background.
Bill
Bill FinzerKeymasterHi Andee,
Thanks for the well-documented bug report!
Bill
-
AuthorPosts