Forum Replies Created
-
AuthorPosts
-
 Bill FinzerKeymaster
Hi Travis,
I believe the crashing behavior is caused by CODAP attempting to make 5000 boundaries, one for each case in Office_Traffic_Stops. The solution is to move CMPD_Division to a parent level and then apply your formula, resulting in 15 boundary values. (Actually only 13 since there seems to be one lookup mismatch.) I suspect that you really are interest in mapping the 5000 stops, though. Points with latitude and longitude would serve that purpose extremely well if you have that data. Here is a link to a revised document.
Bill FinzerKeymasterHello Mike,
As you likely already know there is no CODAP app that runs offline and we do not provide a way to launch CODAP from a “local build.” Getting CODAP started requires an Internet connection. That said, once CODAP is running in a browser it does not require any further connection for normal usage. Have you received reports of students with limited bandwidth at home being unable to launch CODAP at all?
Bill
Bill FinzerKeymasterI dug around a bit and found that CODAP already has a combinations(n,k) function. But you asked for permutations, so perhaps that is no help.
Bill FinzerKeymasterHi Hugo,
This doesn’t help in the short term, but I’ve added a request for a C(n,r) function.
Bill
Bill FinzerKeymasterHi Susi,
That makes sense because desktop NetLogo has no way to include an extension meant to be used in a browser.
I’ll advise Sally of your suggested revision.
Thanks, Bill
Bill FinzerKeymasterHere is a link to a CODAP document that does something similar. Though the only slider showing is for r-squared, if you move the text component you will find collapsed sliders for the other parameters ready to uncollapse and play with.
Enjoy!
Bill
Bill FinzerKeymasterHi Susi,
I believe by extensions the guide is referring to the first line of code. Here’s an example:
extensions [codap nlmap]

turtles-own
    [ sick?                ;; if true, the turtle is infectious
remaining-immunity   ;; how many weeks of immunity the turtle has left
sick-time            ;; how long, in weeks, the turtle has been infectious
age                 ;; how many weeks old the turtle is
num-infections-left   ;; how many others the turtle may still infect
]
...
It’s just the first line that is relevant to you here. It instructs NetLogo to load CODAP extensions.
Hope this helps,
Bill
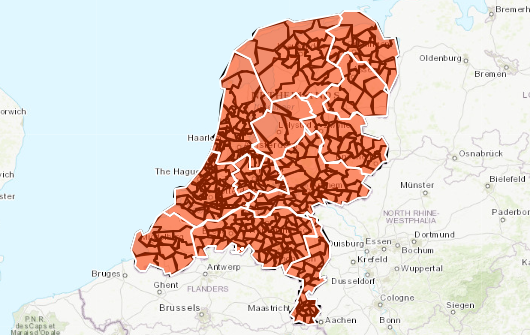
Bill FinzerKeymasterHere is a page with geojson for Dutch provinces and townships that you can download. I dragged them both into CODAP and got the map shown in the attached image and also the thumbnails for the case tables.
Attachments:
Bill FinzerKeymasterSo, if I understand the situation properly, Andee, if you can drag the geojson file into CODAP, then you will get the thumbnails and still have the ability to join (using CODAP’s drag-to-join UI). Presumably you’ll remove the boundary attribute that doesn’t have the thumbnails first.
Good luck!
Bill
Bill FinzerKeymasterHello Thomas,
You’re right. And the same thing happens if you type the values in all upper-case.
We’ll fix this!
Thanks,
Bill
March 28, 2022 at 9:14 pm in reply to: Standard Deviation hover Not Working In Results from Sampler #6938Bill FinzerKeymasterHi Ryan,
Are you hovering over the line at the edge of the SD area on the graph? The middle, light purple portion is not meant to produce a hover tip.
If that’s not the problem, can you send a shared link to the document that exhibits the lack of a hover tip?
BTW, you may not be aware that there is another way to display the values, namely by choosing Show Measure Labels in the ruler menu.
Bill
Bill FinzerKeymasterHi Andrew,
I don’t know of anyone who has tried this. Have you made a document as proof of concept yet? Please keep us posted!
Bill FinzerKeymasterHi David,
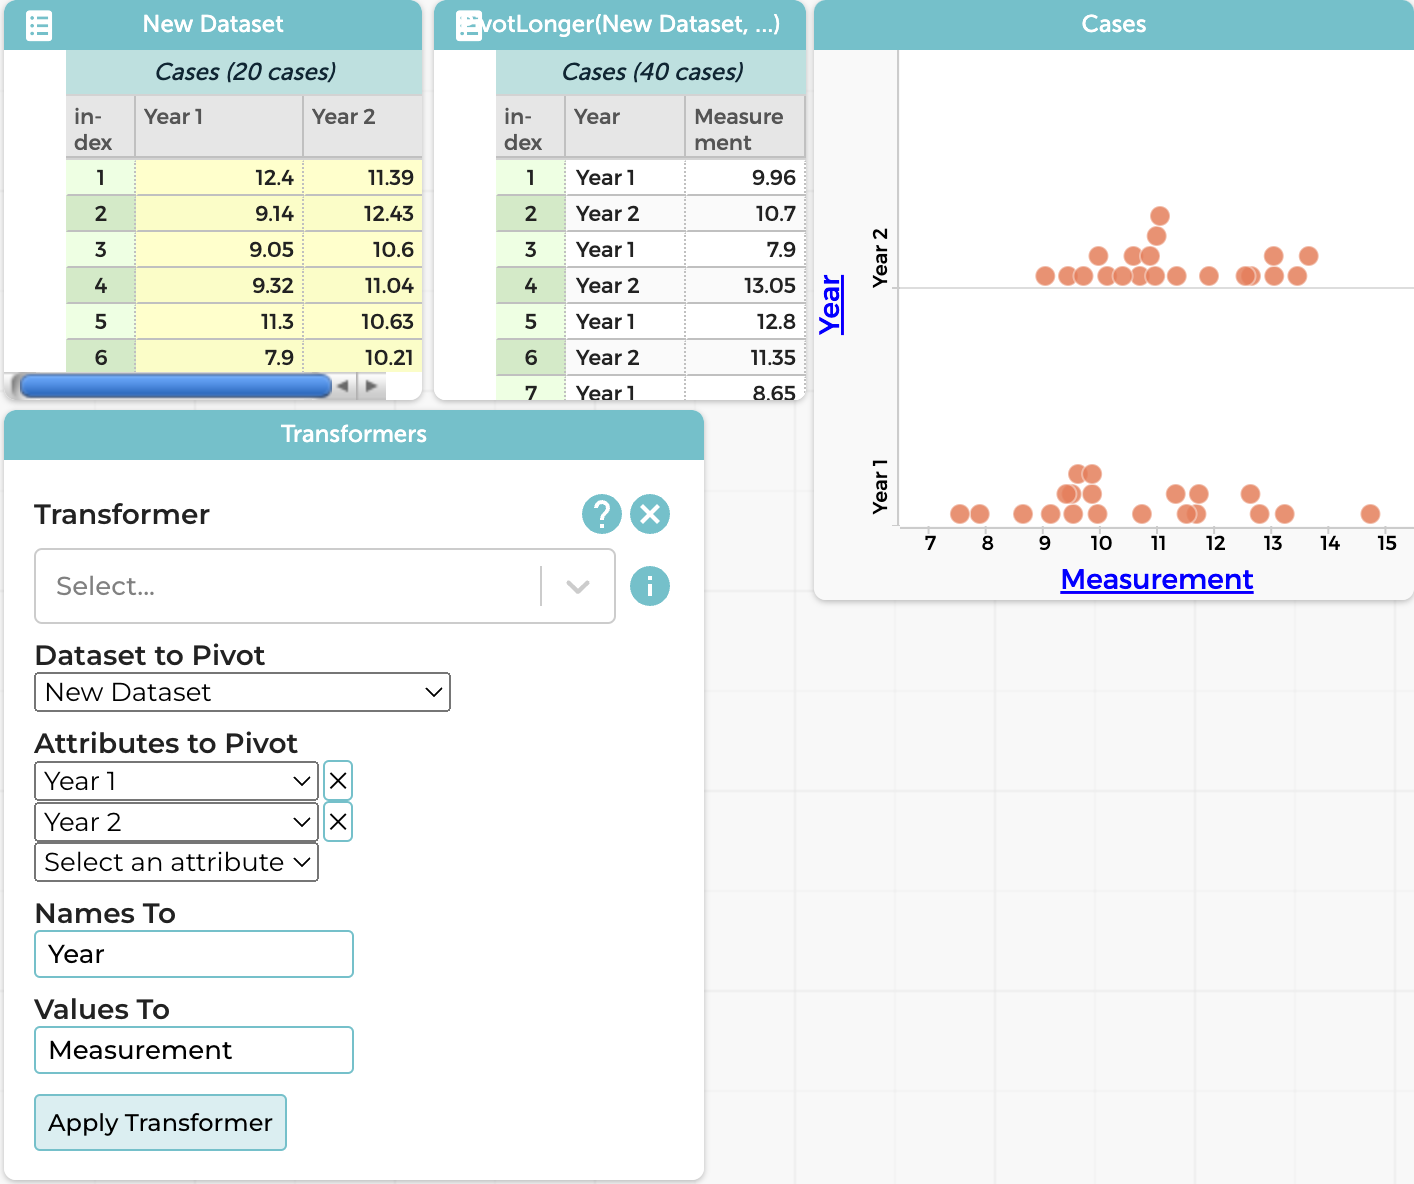
No, sorry, we haven’t provided that capability in CODAP. However, in many situations, the desired plot can be created through a transformation of the data. The screenshot I’ve attached shows the basic idea. The values of the two attributes in the dataset at left are what you want to plot on the same graph. Using the Pivot Longer transform from the builtin plugin Transformers, you create two new attributes, one for year and another for the values. Now you can make the graph!
Hope this helps,
Bill
Attachments:
Bill FinzerKeymasterHello Joachim,
Please take a look at this article for a brief overview.
Transformers includes fairly extensive documentation built into the plugin itself. For each transformer you can click on the ℹ icon to the right of the menu and learn more about it.
Choosy has a big button (shown below) that takes you to a web page with documentation.
Hope that helps,
Bill
Bill FinzerKeymasterHi Andee,
Definitely a bug. Maybe two bugs. We’ll try to have a fix in the next release.
Thanks very much for reporting the problem(s)!
Bill
-
AuthorPosts