Answer: CODAP graphs can only bin one numerical axis. But you can create bins formulaically for a second numeric attribute as shown here. This document randomly generated values for Height and Weight and a slider named interval to control the bin width for a third attribute named Weight_binned. The formula for Weight_binned is
floor(Weight/interval)*interval+" to " +ceil(Weight/interval)*interval
The enclosed screenshot shows the result plot with both numeric attributes binned.
Hi Andy,
First of all, I assume you have set the speed slider in the plug-in to “Fastest?”
If so, then I think the best we can do is to close the case table and/or any plots. (I don’t think making them smaller will help.) Of course you may have reasons for not wanting to do this.
If you like, provide a shared link to the problem situation and we’ll take a look at it.
Bill
Hi,
The following should work:
2.39*x-5.6
2.39*Day-5.6
Or you could create two sliders, a and b, adjusted to -5.6 and 2.39. Then you would plot
b + a*Day or
b + a*x
I hope that helps,
Bill
Hi Wendy,
CODAP doesn’t have any curve fitting capabilities (beyond linear). Of course it’s possible to fit a curve from a chosen family by setting up a slider to vary, and computing squares of residuals whose sum can be minimized, but this is a lot of work.
Bill
Hi Kurt,
There is a good way to do this in CODAP.
- From the Table icon menu choose –new–.
- Rename the AttributeName attribute (using Attribute Properties) to something meaningful, like IQ.
- Click on the green rectangle in the first row and choose Insert Cases….
- Enter the desired number of cases you want; e.g. 1000 and press the Insert Cases button.
- Click on the attribute name and choose Edit Formula….
- Enter the formula
randomNormal(100,10)
That should do it!
BTW, I think you had to leave the webinar before the very end when I did a demo of this very thing! But with sliders!
Bill
Hi Andee,
I was disappointed to find that the movable line disappears when it is exactly vertical. Darn. I’ll log that as a bug. BTW a horizontal movable line works fine.
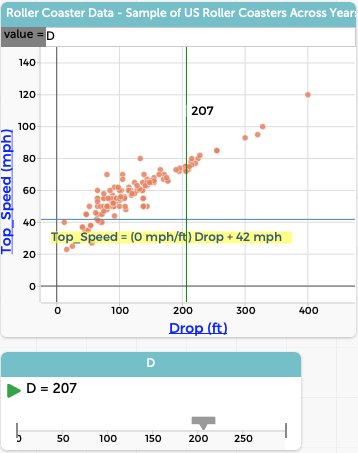
For a vertical line you can use a Slider and Plot Value. Your formula for the plotted value will simply be the name of the slider. Then you can drag the slider to change the position of the vertical line. Not as nice as direct manipulation, of course.
I’ve included a screen shot that shows both a vertical line with position determined by a slider, and a horizontal movable line that you can grab and move directly.
Bill
Hi Jo,
I second Dan’s request for a share link. I tried to duplicate your problem and came up with this document. It has a slider that dynamically affects the value of the attribute group.
Bill
Hi Jo,
I believe you have uncovered a new bug! I thought that all you had to do is to make a new slider and rename it to have the name of the lost slider. But this doesn’t work. It should.
So, what you have to do is create a new slider and name it differently than the lost slider, say “age_filter” (with the underscore character). Now modify the formula (or formulas) that refer to “agefilter” to refer to “age_filter” instead.
Everything should be fine again.
Bill
I created a slider that specifies a parameter “age_threshold = 25,” and I use this parameter in a new variable that I created called “agefilter” to designate individuals under 25 as “young” and those 25+ as “not young.” When I move the slider such that age_threshold = 20 or age_threshold = 10, the values “young” and “not young” do not change appropriately for the variable “agefilter” in my case table. The original parameter of age_threshold = 25 appears to persist in the definition of “agefilter.” Do I need to re-create the “agefilter” variable after I change the age_threshold value in order for the case values for “agefilter” to shift accordingly?
I’m working with some population data and I want to hide/remove individual cases who are under age 25. To do so, I followed a model in which I created a new “agefilter” variable designating people under age 25 as “young” and 25+ as “not young” by writing a formula that refers to a slider parameter that has been defined as “age_threshold = 25.” After doing all this, I accidentally closed out of the slider. How do I get the slider back? It still seems to be in the CODAP document somewhere, because the values generated for the “agefilter” variable don’t disappear, and the “age_threshold” variable remains visible in the list of choices when I click on the “Insert Value” button within the slider.
Hi Michelle,
Great suggestions. You inspired me to look carefully at the options offered by Leaflet, the library underlying CODAP’s map tool. I found ‘worldJump,’ which, when set to true, does part of what you describe. Namely, when you scroll the map horizontally far enough, say to the right, the map wraps and you start seeing points on the left that you had previously scrolled off to the right. This options lessens the likelihood that you’ll get “lost” and be unable to find your data. (Though note that the Rescale button at the top of the map’s tool palette scales the map so that all the data is visible.) Expect to see this enhancement in an upcoming release, perhaps 0412.
Unfortunately, the worldJump option still only allows you to see “one world” at a time, so you can still only see half the ring of fire at once. To help with this, consider using a formula for Longitude such as
if(Longitude_< cutPoint, 360+Longitude_, Longitude_)
where Longitude_ is the original longitude, and cutPoint is the value of a slider. Here is your example modified to include a cutPoint slider.
I’ll have to think a bit more about how hard it would be for us to force map points to automatically plot in whatever world is showing. It seems like it might not be too hard.
So, thanks for your excellent suggestions! You are helping to make CODAP a better educational platform.
Bill