Forum Replies Created
-
AuthorPosts
-
 Dan DamelinKeymaster
P.S. Before changing anything in the registry, be sure to note what was there in order to put it back if necessary.
Dan DamelinKeymasterOK. Getting a bit into the weeds here so understandable if this is not clear. It seems that on Windows the Registry may be used by Chrome to identify the mime type of the file being uploaded. Some other applications can modify this and it might interfere with Chrome being able to recognize the correct file type.
If you are comfortable it would be helpful to:
1. Check the windows registry to see how it maps .csv files to a mime or file type.
2. Change that to “text” to see if that helps.
To accomplish #1:
- Open the Registry Editor by clicking on the windows start icon and searching for “regedit”
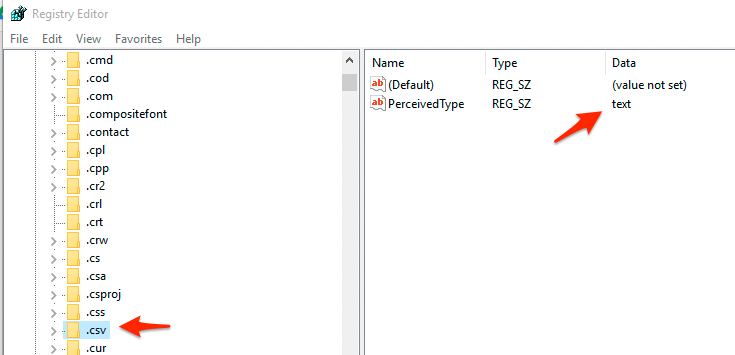
- Drill down to HKEY_CLASSES_ROOT->.csv
- Take a look at what it shows for that. Attached is a screenshot of what I’m seeing on my Win 10 setup.
To accomplish #2:
- edit the “PerceivedType” or “Content Type” to be “text” if yours is not already “text”
- reboot and try csv drop again
Attachments:
Dan DamelinKeymasterWindows 10 and updated Chrome worked for me as well.
In addition to Bill’s suggestion above you might also try clearing your browser cache (or opening CODAP in an incognito window).
Dan DamelinKeymasterI was able to import that csv into CODAP using Chrome without issue.
What version of the Chrome browser are you using?
Have you installed any new browser extensions recently?
Is your computer managed by your school? Could they be blocking uploads on Chrome?
Dan DamelinKeymasterCan you add the csv file as an attachment so we can take a look? Just tested a local csv and that worked, so it’s not a general issue with importing data.
Dan DamelinKeymasterBill if movable values could be captured in the formulas, then one could manipulate the line and see reflections in the formulas automatically updated. Not sure how often a feature like that would be used though.
Dan DamelinKeymasterThis doc shows some options. One can calculate a count or calculate a quadrant and then color by quadrant. If you turn on “show measures for selection” in the graph, then clicking on one of the quadrants in the legend will select just those and show a count in the upper right. https://codap.concord.org/releases/latest/static/dg/en/cert/index.html#shared=https%3A%2F%2Fcfm-shared.concord.org%2FhsqIEZxkwpcYCUHSyR35%2Ffile.json
Dan DamelinKeymasterUnfortunately Google Drive does not provide you a direct link to the csv file, so CODAP can’t import using the share URL Google Drive provides.
If you could post to a server that provides public, web-accessible, direct URLs to files then what you are trying to do would work.
Other options using Google Drive:
- On a Google Sheet you can use File->Share->Publish to web. Then the URL you get from that can be given to students which, when clicked on, will initiate a download of a CSV automatically. Then this can be dragged into CODAP. It eliminates one step from them having to download manually.
- You can copy and paste data from a Google Sheet into CODAP. Give them a link to a Google Sheet. Have them select all (command-a or control-a). Then open CODAP and click the Tables button and choose “–new from clipboard–“
Hope that helps.
Dan DamelinKeymasterAndee, I’d love to hear more about these strategies.
Dan DamelinKeymasterWell, this is not ideal, but if your range for n is limited enough, you could create one table that calculates the various values for n, and then use that table as a lookup for your own n! function. (The lookup table could be closed, so it would not be visible.)
See example here:
Dan DamelinKeymasterI was blocked from uploading the geojson file so here’s a link to it:
Dan DamelinKeymasterI wanted to learn a bit about the geojson format myself, so in playing around I made a version of the file you sent with the boundaries that have thumbnails.
To make this I ended up doing some combination of formulas in excel and cutting and pasting to make the geojson file from the data that was there. Then I imported the geojson into codap, exported that and pasted the new polygon features with added thumbnail over what was there in the csv.
(Bill I tried to join after importing the geojson but could not get that to work correctly.)
Attached is the geojson file I created as well.
Dan DamelinKeymasterAlison,
Unfortunately, given the list of sensors you described, they are all wired sensors, which won’t work using our software on Chromebooks. To directly connect sensors to work in CODAP on Chromebooks you would need sensors from the Go Direct line of wireless sensors.
There is still a possibility to use Vernier’s own software (perhaps Graphical Analysis) to collect data, export it as a CSV file, and then drag it into CODAP. But that might be too cumbersome, especially for that particular activity you mentioned above.
Dan DamelinKeymasterThese links worked for me in multiple browsers, each loading the document within a few seconds. One possibility might be that the school internet filter is now preventing some access to resources being loaded by CODAP. You mentioned that several teachers are reporting this issue. Are they all in the same school? Could be that whitelisting *.concord.org could fix the issue.
Dan DamelinKeymasterThe idea of being able to draw regions on an image is intriguing, opening up the possibility for different kinds of infographics…
-
AuthorPosts