Forum Replies Created
-
AuthorPosts
-
 Bill FinzerKeymaster
Se me ocurren dos formas de calcular los valores de los quintiles de una distribución: una usando fórmulas en una tabla de casos; y un segundo en el que los valores móviles se ajustan manualmente para estar cerca de los valores deseados. Ambos se ilustran en el documento CODAP vinculado a continuación.
Bill FinzerKeymasterLo siento, pero no estoy seguro de entender tu pregunta. Aquí hay algunas cosas para probar:
1. Muestre un diagrama de caja en el gráfico. Esto le dará acceso a los valores para los percentiles 25, 50 y 75 que puede obtener al pasar el mouse sobre partes del diagrama de caja.
2. Use la habilidad “Plot Value” para trazar, por ejemplo, percentile (edad, 33).
Espero que sea de ayuda. Si no, intente ser más específico sobre lo que le gustaría lograr.
(Disculpas por mi español. Estoy usando Google Translate.)
Bill FinzerKeymasterThere are no built-in regression models in CODAP other than linear (yet). This is a consequence of no funded collaborating projects having yet requested such a feature.
Bill
Bill FinzerKeymasterHello Daichi,
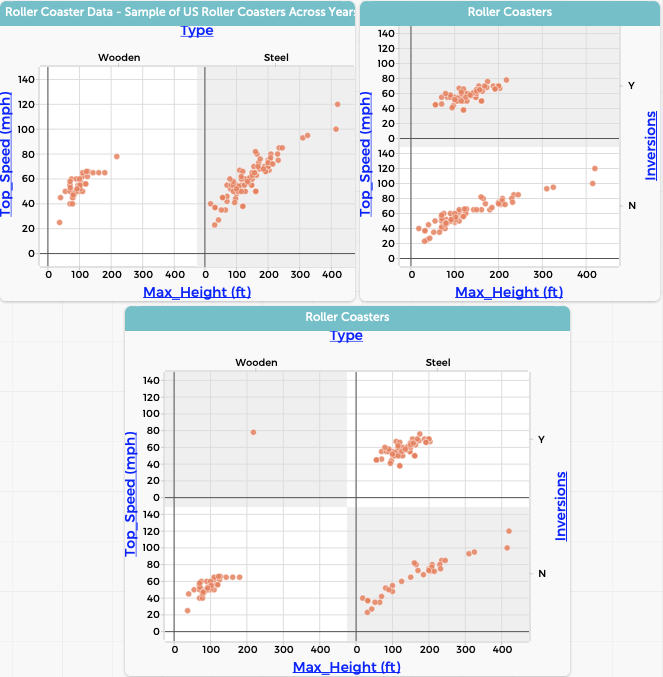
Let’s say you have a plot with x, y, and/or legend attributes. Now you can split this plot by the categories of a categorical attribute by dropping that attribute on the top axis area or the right axis area.
Dropping the categorical attribute on the top axis splits the plot horizontally so that you have the sub-plots laid out left to right. Dropping the categorical attribute on the right axis lays them out top to bottom.
You can actually drop categorical attributes on both the top and bottom!
I’ve attached a screenshot of these three possibilities.
Hope this helps,
Bill
Attachments:
Bill FinzerKeymasterHi Kathy,
Thanks for this! You and your students found a bug in the abs function. The difference of the missing value and the mean is correctly evaluated as a missing value, but abs incorrectly reports zero instead of missing. Please convey our thanks to your class!
The bug fix will probably appear in less than two weeks. I’m sorry your teaching moment will be taken away. 😉
Bill
Bill FinzerKeymasterHi Andy,
First of all, I assume you have set the speed slider in the plug-in to “Fastest?”
If so, then I think the best we can do is to close the case table and/or any plots. (I don’t think making them smaller will help.) Of course you may have reasons for not wanting to do this.
If you like, provide a shared link to the problem situation and we’ll take a look at it.
Bill
Bill FinzerKeymasterHi Michelle,
Thanks for adding “another data point.” You’ve shifted its priority.
Bill
Bill FinzerKeymasterHi Joachim,
Yes, it is possible to stack the data. You use a handy little plugin that Jonathan Sandoe wrote called the Attribute Stacker which you can find on the CODAP Data Interactives page. I’ve made a little movie showing how to do it. (In it I have way fewer years, of course.)
Here is the movie. I hope it helps!
Bill
Bill FinzerKeymasterHi Andee,
The latest release (0510) has the fix for this bug.
Bill
Bill FinzerKeymasterWell, the bug only got introduced a couple months ago. 🙂
Bill FinzerKeymasterHi Andee,
Found and fixed the bug. The fix will appear in build 0510. Due to vacation interruptions in development that won’t be until about January 17.
Happy New Year!
Bill FinzerKeymasterHi Andee,
Thanks very much for this bug report! I suspect it has something to do with missing values. I’ll log it and mark it high priority.
Bill
p.s. It’s generally not a good idea to share links to documents on Google Drive since, depending on permissions, anyone who opens it can make changes to it. Better to use Sharing.
Bill FinzerKeymasterSorry, it’s “extra-project” work so I wouldn’t count on it for February.
Bill FinzerKeymasterHi Andee,
You found the preferred method—download as CSV and drag (or import) the file into CODAP.
We’ve got some background work going on to make this easier and to also append data to an existing dataset. Stay tuned. (But for now, there’s no way to append data.)
Bill
Bill FinzerKeymasterHello Daichi,
The Fast Plants data is fictitious, created to provide a context to help us do some research on how students perceive hierarchical data. You read about this research here.
You ask about a Japanese localization. We rely on volunteers for this effort. If you know someone who would be interested and able to translate CODAP into Japanese, please put them in touch.
Bill
-
AuthorPosts