Forum Replies Created
-
AuthorPosts
-
 Bill FinzerKeymaster
Yes, that’s correct.
CODAP development happens in collaboration with projects that can provide funding for desired features. Hollylynne’s ESTEEM project funded Sampler development to its current state. There are a number of folks seeking funding to continue work on the Sampler to bring its functionality to at least the level provided in TinkerPlots. But for now, no linked samplers. 🙁
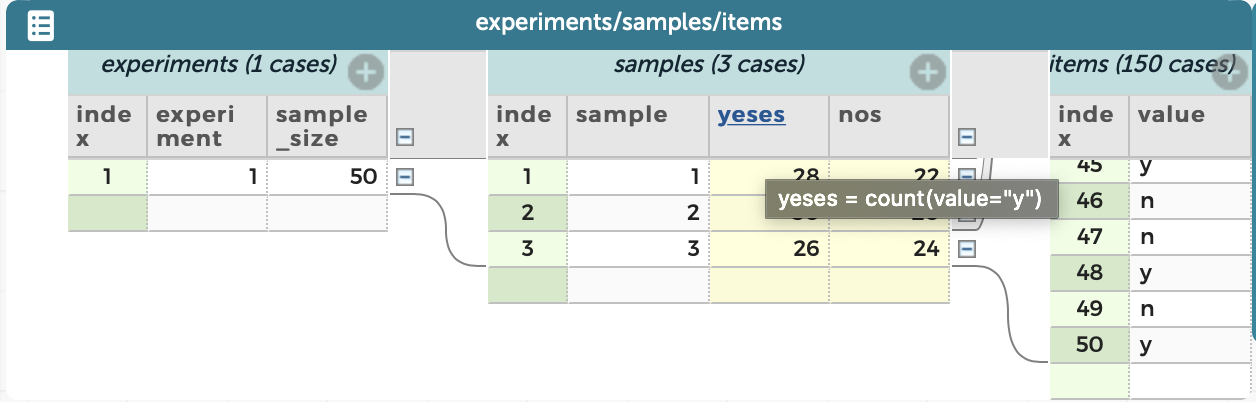
Bill FinzerKeymasterThe count function applies to the cases at the next level. So, as you can see in this screenshot, if you use the formula at the samples level, it does the right thing. Hope that works for you!
Attachments:
Bill FinzerKeymasterHi Anna,
Yes, it would be very nice to have a function “countUnique” or some such that returned the number of unique values of an attribute. I’ll add this to the feature request list!
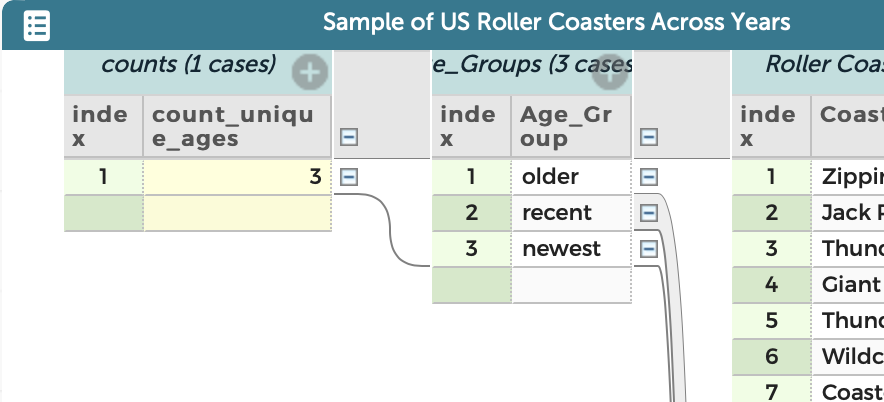
I understand why you might not be a fan of your workaround. 😉 Another workaround you may have thought of is to group by value by moving the value attribute all the way to the left. Now, of course, the count of unique values is the number of rows at that level. If you want a computed count of unique values, you can define an attribute one level higher that counts those rows.
The enclosed screenshot shows the situation using the Roller Coasters example doc.
Bill
Attachments:
Bill FinzerKeymasterPlease see this thread.
Bill FinzerKeymasterHi Kristen,
The short answer is that CODAP does not provide any way to adjust the numeric legend color scale. As far as I know you are the first person to express a desire for this. Four years ago when we implemented the feature we thought users might want to adjust things but decided to wait and see. Now I’ll certainly add your feature request to our list.
Perhaps you could say a bit about the context in which you are using CODAP and how it would help you to make these adjustments?
Thank you!
Bill FinzerKeymasterYour question has a simple answer. From the menu in the upper-left of the window, choose Share/Get link to shared view.In the resulting dialog box, click the Enable Sharing button. This gives you a link to a shared view of your document which you can distribute to students. When students click on the link they will get a copy of your document to work with.Bill FinzerKeymasterHere is CODAP’s source code for the computation:
/**
 * Get the quantile
 * @param iArray Sorted array of finite numeric values (no non-numeric or missing values allowed)
 * @param iQuantile {Number} quantile [0.0-1.0] to calculate, e.g. first quartile = 0.25
 * @return {Number} median value or undefined if ioArray.length===0
 */
quantileOfSortedArray: function (iSortedArray, iQuantile) {
  var lastIndex = iSortedArray.length - 1,
      i = lastIndex * iQuantile, // quantile's numeric-real index in 0-(n-1) array
      i1 = Math.floor(i),
      i2 = Math.ceil(i),
      fraction = i - i1;
  if (i < 0) {
    return undefined; // length === 0, or iQuantile < 0.0
  } else if (i >= lastIndex) {
    return iSortedArray[lastIndex]; // iQuantile >= 1.0
  } else if (i === i1) {
    return iSortedArray[i1]; // quantile falls on data value exactly
  } else {
    // quantile between two data values;
    // note that quantile algorithms vary on method used to get value here, there is no fixed standard.
    return (iSortedArray[i2] * fraction + iSortedArray[i1] * (1.0 - fraction));
  }
},
As you can see in the last line, when desired quantile falls between two values, the returned value is the lower value plus the fraction of the distance between it and the next value.
Bill FinzerKeymasterHi Andee,
Interesting question. As the programmer for graphs I should be able to lay out the heuristics that determine whether a scatterplot (or any plot with a numeric axis) rescales.
The plot will rescale when:
- You press the Rescale button at the top of the graph’s “inspector.”
- An attribute is added to an axis or the legend.
- An attribute already on an axis or legend is changed to a different attribute.
- An attribute on an axis or legend is removed.
- One or more cases are added that have values for the plotted attributes that lie outside the current axis bounds.
- Points that have been hidden are shown and some of the values lie outside the current axis bounds.
- Cases that have been set aside are restored and some of the values lie outside the current axis bounds.
The plot will not rescale when:
- A case value is changed even if that value lies outside the current axis bounds.
- Cases are added but their values already lie within the current axis bounds.
- The graph is moved or resized.
- Points are hidden or their corresponding cases are deleted or set aside.
These heuristics evolved during the development of Fathom. I think you may be the first person expressing a desire to know what they are. And I don’t recall anyone ever asking that we change the rules, at least since the very early days.
Bill
Bill FinzerKeymasterThere is no CODAP react component or npm package. The simplest integration is with embedded iFrames that point to shared views of CODAP documents. See this recent blog post for an example.
Integration is also possible through CODAP’s plugin API. Here is an example of that. (Use the Add Graph and Add Table buttons to see CODAP functionality as part of the OceanTracks page.)
Bill FinzerKeymasterHello Anna,
Somewhat unfortunately, the documentation for importing CSV data through the URL is somewhat buried in CODAP’s github site. You can find it here.
There is another gotcha however, namely that CODAP runs as a “secure” site with. As such, the site accessed by the URL parameter must also be secure. So the URL you would use will need to have the ‘https’ prefix as in
https://codap.concord.org/app/?url=https://mywebsite.com/fjdkfjk.csv
Here’s what Jonathan Sandoe has to say in an email to another user:
The issue is that the link is to an insecure http address and CODAP is running with an https URL. Browser rules (quite reasonably) prevent a secure page from loading an insecure file. I tried modifying the URL to “https://xyz.com/Sample.csv” but the server doesn’t appear to support https.
If you are affiliated with the owners of xyz.com in any way you could request that they support HTTPS. It’s probably a good idea for them anyway.
The other network bugaboo that limits CODAP’s ability to read data from a third party sources are same origin policies (CORS). Servers can be configured to restrict the ability of browser apps to read their data. If a CSV file’s server is configured in this way, CODAP will not be able to use it directly.
Bill FinzerKeymasterNo, sorry, there isn’t. (We have in mind a future feature that will make capturing such things easy.)
But you can use the camera menu to open the graph with the draw tool to add the value by hand.
Bill FinzerKeymasterHi Stephanie,
Yes, there are ways to massage dates from the bewildering variety of formats in which they appear into formats that CODAP can deal with (without having to type them in by hand.
In the case of the Salinity data, it didn’t prove too hard, though there is one apparent CODAP bug that gets in the way. I’ve updated the CODAP document so it now shows both datasets and has some numbered instructions that came from my efforts. For convenience, here they are.
- Rename the two attributes.
- Set the first attribute Type as Date.
- Set the second attribute type as numeric.
- Delete the first case.
- Make the scatterplot.
- Note that (for some reason) the date scale only goes through 2015. With your mouse cursor on top of Oct, click and drag to the left so that the rest of the points come into view.
I’d say you’re getting a taste of what data scientists and other data folks confront every day.
Bill
Bill FinzerKeymasterHi Stephanie,
As I suspected, the problem was turning the MONTH attribute into a valid date.
Here is a CODAP document with the data properly munged.
I was able to do it with formulas, but it would have been a lot quicker and easier to just type them in. I erased all the formula work because it was so awkward.
Hope this helps,
Bill
Bill FinzerKeymasterHi Stephanie,
Yes, there is a fix. I just need to see the data to describe it.
Unfortunately I couldn’t access your CODAP file on Google Drive. But you can upload the CSV file here.
Or you can go to the top-left menu and choose Share followed by Get Shared Link. Then post the link here. I’ll be able to view and edit a copy of your document without changing the master.
Thanks, Bill
Bill FinzerKeymasterHi Stephanie,
I wonder if the time attribute is not being correctly interpreted? Could you either provide a link to a shared view of your CODAP document, or upload a CSV file of your data so we can take a look?
The “Connecting Lines” option is only available when you have a scatterplot; i.e. when both axes have a numeric attribute. I suspect that your time attribute is being treated as categorical so what even though your graph looks “sort of” right, it’s actually a dot plot and not a scatterplot.
Bill
-
AuthorPosts