Forum Replies Created
-
AuthorPosts
-
 Bill FinzerKeymaster
Hello Shauna,
The current CODAP sampler does not make this easy, more’s the pity. But it is possible, though with the collector rather than a spinner. (You may have already figured this out?) I’ll list my steps and I’ll include a link to the document that has the result.
- Add the Sampler plugin (of course)
- With the Table tool, make a <new> dataset.
- Click on the green rectangle on the far left of this table and choose New Cases.
- Enter 200 and press the New Cases button.
- You could hand enter 191 “yes” values and 9 “no” values, but it’s simpler to use the formula: if(caseIndex<191,”yes”,”no”)
- In the Sampler, choose the Collector device.
- Fill in the number of items and samples you want and press Start.
Whew! Sure hope we get to continue Sampler development soon!
Here is a link to a worked out example.
Bill FinzerKeymasterHello Zac,
Thanks for this post. Currently there is no way to control dot size in either maps or graphs. We’ve thought about providing this capability, and it helps to know that there’s someone out there who would like it! I’ve boosted its priority in our list of requested features.
Bill
Bill FinzerKeymasterHi Sue,
Yeah, that bug crept into the current release. But it’s fixed for the next release.
Thanks for reporting it. We appreciate hearing about bugs even if we already know about them.
Bill
Bill FinzerKeymasterBill FinzerKeymasterHi Andee and Traci,
You’re definitely making me reconsider the design decision to list categories on the y-axis from top to bottom. Traci’s example of the “nonsensical” behavior of the reordering that occurs when switching back and forth from numeric to categorical is particularly persuasive. Also, I have to remind myself that the decision in Fathom was based on the presence of a summary table, which we do not have in CODAP.
So I’ll post the story in Pivotal Tracker, our bug and feature tracking system.
Thanks for your thoughts!
Bill
Bill FinzerKeymasterThere are no pending requests for histograms, but there is always the possibility that such a request will come from a collaborator with funds to pay for its development.
BTW, if you can reasonably treat the numeric variable as categorical, then you can turn the dot chart into a bar chart, which has a count axis.
Bill FinzerKeymasterHi Andee,
The main reason is pedagogical. Having a count axis can distract students from the shape of the distribution which is generally what we want them to focus on.
Another reason is that the number of dots in a stack is so dependent on the size of the dots and the resolution along the axis. I suppose there may be situations in which this number is useful, but I’ve never encountered one that made me think it was worth adding the widgetry and corresponding distraction. Interestingly, in 5 years of collaboration with projects that could have asked for it, not one has done so.
BTW Fathom doesn’t show a count axis. (TinkerPlots does.) But, of course, in Fathom you can get a histogram with count axis.
Bill
Bill FinzerKeymasterHi Andrew,
When you get to the Shared view: disabled dialog box, is there an ENABLE SHARING button as shown in the screen capture enclosed here?
If so, press that button. If not, can you share a screen capture of what you’re seeing?
Bill
Attachments:
Bill FinzerKeymasterHi Traci,
Thanks for your thoughtful response. I can supply the reasoning by which we came to the decision to order a categorical y-axis from “low” to “high” starting at the top instead of the bottom.
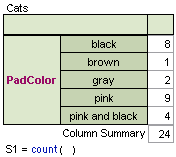
It came about 15 years or so ago working on Fathom, CODAP’s predecessor. In Fathom there is a summary table that lists an attribute’s categories as shown in the accompanying screenshot. In the table, it made sense, if there were an ordinality to the categories to list them from top to bottom. Having a different order when the categories were listed on the y-axis was untenable.
In CODAP we don’t (yet) have a summary table. But I think an argument can still be made for the current behavior in that we read (at least in English) from left to right and then from top to bottom. We can view the categories listed on the y-axis as a list, and, in fact, making such a graph is a useful way to view all the categories (provided there aren’t way too many!).
So that’s the story of why categories are ordered left to right or top to bottom. Numerical axes have an origin at the lower left.
I welcome comments from other participants in this forum.
Bill
Attachments:
Bill FinzerKeymasterHi Andee,
Yes, that’s correct, the new order will apply everywhere from then on (until you change it again). In fact, if you have two graphs that use the same categorical attribute and you reorder in one you will see the reordering take place dynamically in the other as well.
Bill
Bill FinzerKeymasterHi Jo,
I second Dan’s request for a share link. I tried to duplicate your problem and came up with this document. It has a slider that dynamically affects the value of the attribute group.
Bill
Bill FinzerKeymasterHi Jo,
I believe you have uncovered a new bug! I thought that all you had to do is to make a new slider and rename it to have the name of the lost slider. But this doesn’t work. It should.
So, what you have to do is create a new slider and name it differently than the lost slider, say “age_filter” (with the underscore character). Now modify the formula (or formulas) that refer to “agefilter” to refer to “age_filter” instead.
Everything should be fine again.
Bill
Bill FinzerKeymasterHi Jo,
Good question!
The very first time you use a categorical attribute in a graph, it will be ordered alphabetically. After that, there is no automatic way to resort the categories, so you have to do it by hand. The ordering of the categories becomes part of the attribute itself.
Bill
Bill FinzerKeymasterAh, I’m guessing from your screen shot that you’d like to display the units of the attribute?
No problem! In Edit Attribute Properties, you can specify the units, and these will be displayed very nicely in parentheses in the column header and on graph axes. Furthermore, you won’t have to worry about them in any formulas you write that refer to an attribute.
Bill FinzerKeymasterHi Sue,
Text between angle brackets is stripped out of attribute names when they are displayed in the case table. But if you bring up Edit Attribute Properties you’ll see that the angle brackets and text between them is still there.
Any text before the ‘<‘ character and after the ‘>’ is displayed as normal.
Angle brackets in HTML are used as part of the markup and I believe they are triggering something in the case table display that we could probably get around. But I would recommend avoiding their use!
Can you be more specific about the problem with $ signs? I couldn’t get anything strange to occur with them.
Bill
-
AuthorPosts