Forum Replies Created
-
AuthorPosts
-
May 28, 2019 at 4:58 pm in reply to: How to reproduce least squares line with a plotted function #922
 Bill FinzerKeymaster
Hi Josh,
It is possible, of course to add quadratic fitting. That starts us down a slippery slope, though, that includes polynomial fitting and exponential/logarithmic fitting. All that functionality can be pretty off-putting to non-math-geeks. So we’d have to figure out how to provide it without cluttering things up. Maybe in a plugin?!
Bill
Bill FinzerKeymasterHi Steen,
Jonathan is on vacation this week, but next week he’ll set you up for Danish. Thank you ever so much for being willing to give this a try!
Bill
May 27, 2019 at 8:57 pm in reply to: How to reproduce least squares line with a plotted function #919Bill FinzerKeymasterHi,
The following should work:
2.39*x-5.6
2.39*Day-5.6
Or you could create two sliders, a and b, adjusted to -5.6 and 2.39. Then you would plot
b + a*Day or
b + a*x
I hope that helps,
Bill
Bill FinzerKeymasterI’m sure you’re right about the problems that having two logins can pose. I’ve seen that, too. Thanks for posting, including the solution!
Bill FinzerKeymasterHi Tim,
You are the first to request rank. I’ll put it at the top of the feature requests!
Bill
Bill FinzerKeymasterSorry, the sampler doesn’t support those input options. But I can see why you might want them! I’ll enter a feature request.
Bill FinzerKeymasterThanks for pointed out that the MAD is part of middle school common core. I’ll enter feature requests for both displaying it on a graph and for a function to compute it.
Bill FinzerKeymasterDefinitely a bug! And you get first call on it. Thanks very much. And nice workaround.
Deleting the measures on Clear Data was by design with the idea that you would be moving on to a new model-making activity. But you’re not the first to wish it were different, so perhaps we’ll rethink. A workaround is to use “Delete All Cases” in the table menu as that leaves all the attributes intact.
Bill FinzerKeymasterThank you very much for this bug report for the Sampler plugin!
I was able to observe the bug in Safari on a Mac (though not, for some reason in Chrome).
I found that I could edit the labels for the spinner, so that might be a workaround in some situations.
We’ll fix this asap!
Bill FinzerKeymasterHello Chad,
Thank you for posting this question, especially as I imagine quite a number of those who wish to use CODAP with real data find themselves in similar situations.
One very incidental help is an improvement to your formula for HOURS. I suggest “HOURS=split(Start_Time, “:”, 1)” which will grab the first item in a list delimited by the colon.
As you may know, you can create a CODAP “plugin” that massages the data. You can learn about these in this Getting Started Guide. But, of course, you have to know a bit of JavaScript to create a plugin.
Another approach might be to automate the preparation of the data using something like Excel Macros. If you aren’t able to do this yourself, perhaps you can find a spreadsheet guru who could whip something up. I think the end result would allow students to quickly transform their csv into something ready to drop in and use in CODAP.
Bill
Bill FinzerKeymasterHi Kimberly,
Regarding how to make a dataset with different numbers of colored balls: You don’t actually have to write a formula. You can do it using CODAP’s case table as shown in this video.
Bill FinzerKeymasterHello Sandra,
I wonder if you have looked through the CODAP help. This is a good way to get started.
Bill
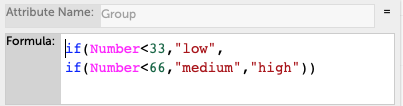
Bill FinzerKeymasterSuppose we have numeric values ranging from 1 to 100 that we wish to break into three groups: “low,” “medium,” and “high.”
We use the formula:
if(Number<33,”low”,
if(Number<66,”medium”,”high”))The screenshot shows the formula for this as it appears in the formula editor.
Hope that helps.
Bill
Attachments:
Bill FinzerKeymaster¡Hola Hugo!
It’s wonderful to hear that you’re using CODAP in this way. Truth be told, we don’t yet have an easy way for users to share documents with the user community. But perhaps now is the time. Would you mind sending a link to a shared view of your pyramids data so we can take a look?
And BTW, are you and your on-line users using the Spanish version of CODAP? If so, do you have any recommendations for improving the localization?
Bill
Bill FinzerKeymasterHi Traci,
My favorite way to do this is to drag the original attribute all the way to the left so that things are grouped by those categories. Then edit the “none” cell to say “none to little” and, likewise, edit the “little” cell to say the same thing.
They won’t instantly combine (too bad), but if you drag the attribute back to the right and then back to the left, you’ll see that they have been combined.
Hope that helps,
Bill
-
AuthorPosts