Forum Replies Created
-
AuthorPosts
-
 Bill FinzerKeymaster
Hi Andee,
It’s possible the SmartBoard is translating your gestures into touch events. If this is the case, there are many known CODAP bugs with touch devices. I believe the two you mention are among them.
The good news is that we’re about to come out with a release (~mid-August) that should fix most of the touch device problems.
Bill
Bill FinzerKeymasterHi Sue,
As Dan points out, the fact that CODAP becomes fully resident on each user’s computer should rule out any problems with large numbers of users.
As to stability over time, CODAP is evolving so there will continue to be improvements in performance and usability as well as enhanced features. It’s certainly possible that some changes in CODAP will require changes to the instructions in the course materials. One way to deal with this is for your institution to serve a single, stable version of CODAP during a run of the course. This is very straightforward, amounting to little more than unzipping a file onto your server and pointing your users to that URL.
Hope this helps,
Bill
Bill FinzerKeymasterHi Kristyn,
I can think of one way, but not sure if it will do what you want.
- Suppose you have an attribute A and you have typed values into the first four cases.
- Create an attribute B with the formula: if(caseIndex<5,A,random()). This copies the entered values from A into B and puts random numbers in the new cases as values for B.
- Now add a bunch more cases; e.g. by clicking on row 5’s index and choosing Insert Cases.
Bill
Bill FinzerKeymasterHi Andee,
I’ve seen this too, and you’re absolutely right. It seems to be a relatively newly introduced bug that needs fixing.
Bill
Bill FinzerKeymasterHi Kristyn,
Yes, you can restrict the range. Here is an example that plots the square root of between 3 and 9:
if(x>3&x<9, sqrt(x),””)
Re: 2 functions—A possible trick (not recommended) is to make a second graph with the second function. Then give it a transparent background and place it on top of the first graph.
But eventually we’ll provide the ability to plot multiple functions in a graph with no tricks.
Bill
Bill FinzerKeymasterI was able to replicate the problem.
- Create a new document and change its name to “First.”
- Save this document to Google Drive.
- In CODAP, change the document name to “Second.”
- In the Share menu choose Get Link to Shared View.
Notice that the name of the document reverts to First immediately. (Bug!)
If you go on to get the link and open it, the shared view has the name First. In fact, all trace of “Second” is gone.
Andee, I’d say you’ve uncovered a nice little rat’s nest of bugs here! Thanks.
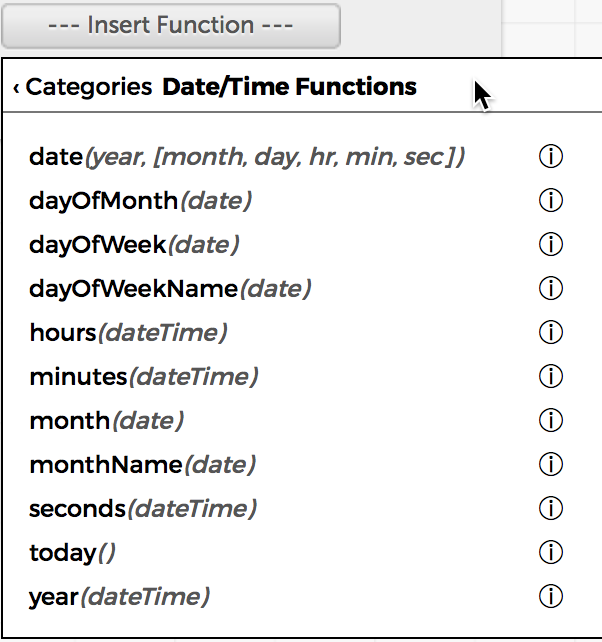
July 23, 2018 at 6:19 pm in reply to: Create Month and Year Attribute from Existing Date Attribute #609Bill FinzerKeymasterHello Heinrich,
CODAP has a pretty complete set of functions for manipulating dates and times as you can see in the enclosed screenshot.
Bill
Attachments:
Bill FinzerKeymasterHi Kristyn,
Here’s a formula that will produce integers from zero to nine:
floor(random(0,10))
And if you want them to go from one to ten:
ceil(random(0,10))
Of course you can change the zero and ten to anything you want.
Bill
Bill FinzerKeymasterHi Traci,
Regarding freezing columns, I’m sorry to report there is no way to do this. A recently introduced feature to convert a case table into a case card might be helpful to you since it makes it much easier to work to work with a large number of attributes. But, then again, since you are also scrolling vertically, perhaps not.
Regarding hiding columns, there’s no interface for it. Sorry. There is a way to do it by editing the JSON text of the document, but I don’t think that is appropriate for either your situation or the situation you describe for students. We’ve received a number of requests for hiding columns through the interface and will likely provide it sometime soon.
Bill
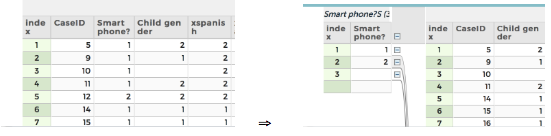
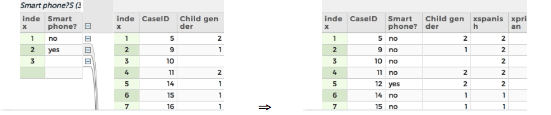
Bill FinzerKeymasterHello Traci,
Excellent question, with what I hope you will find to be an excellent answer!
In the first screen capture on the left you see typical survey data with Smart Phone? coded with 1, 2, or blank. On the right you see the result of dragging that attribute all the way to the left to form a group for each value as shown on the right.
Fortunately, those values are editable! So, in the second screen capture on the left, you see the result of editing the 1’s to no and the 2’s to yes. Then, dragging the attribute back to the right flattens out the table again.
No formulas required! I hope this makes sense.
Bill
p.s. I think replacing the numbers with meaningful words is an excellent idea, no matter the age of the user.
Attachments:
Bill FinzerKeymasterHi Andee,
We’re not experiencing this problem here. Questions:
- Is it one particular document that won’t save properly or do you find that no document can be saved?
- When you attempt to save to Google Drive, do you see the ‘.codap’ file in your drive? If so, could you enclose it or give us a link to it?
- Can you open Chrome’s inspector (Cmd-option-i) and see if anything is being written to the console that might be helpful to diagnosing the problem?
CODAP is working fine on all “modern” browsers as far as we know.
Bill
Bill FinzerKeymasterHello again,
I neglected to address the rationale. Thinking about the situation, there are two kinds of “cases”: states, and rates. Each state has a rate for each year, and each rate for a given year belongs to a certain state. This implies a hierarchy. Row by column structures are far from ideal for modeling hierarchies. CODAP allows you to create any number of levels, and this works very well for a surprising number of situations.
Bill
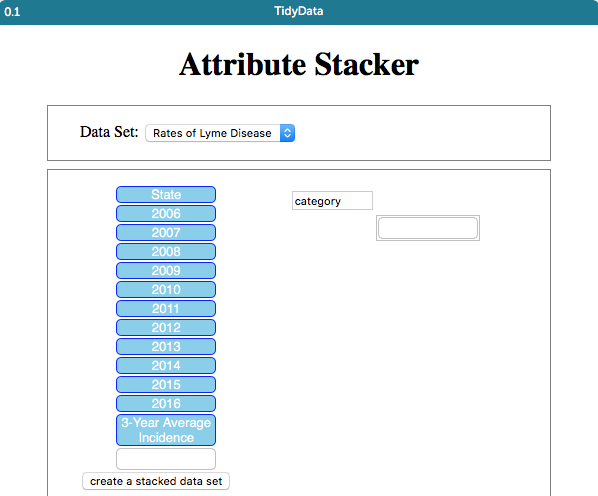
Bill FinzerKeymasterHello,
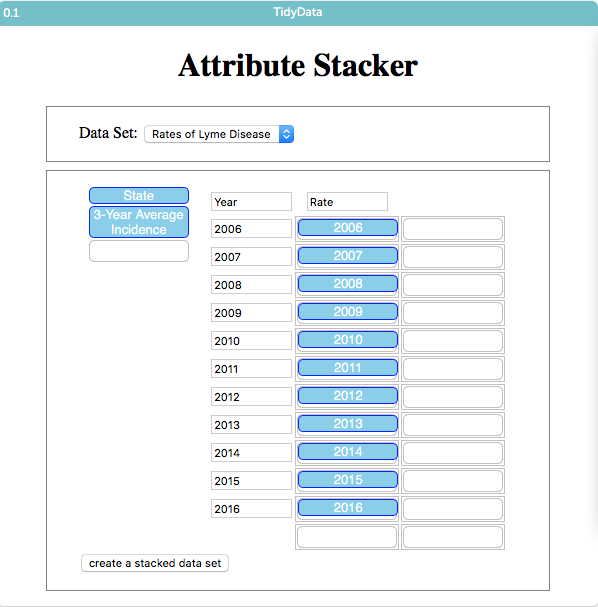
There’s a nice solution to this. Go to CODAP Data Interactives and scroll down to the Attribute Stacker.
- Set things up so you can drag the “Embeddable Link” for the Attribute Stacker into your CODAP document. Having done so, the stacker will look like the first screen capture.
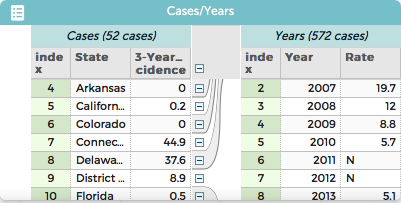
- In the stacker, drag each of the year attributes into a slot on the right so that it looks like the second screen capture. Also, provide Year for a category name and Rate for a value name.
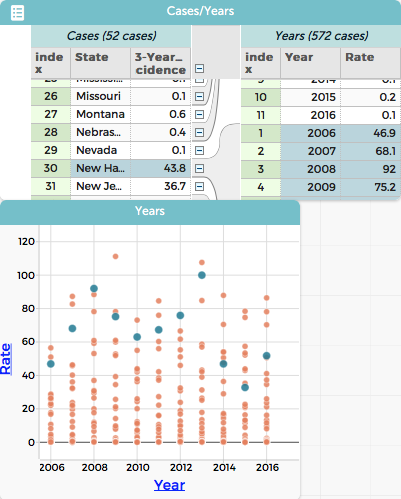
- Press the Create a stacked data set button. This will give you a data set like the one in the third screen shot.
Notice that some of the values under Rate are not numbers. You may want to edit those values to be blanks so that making the graph shown in the final screen shot will be easier to make.
Notice that selecting a case at the state level selects all the points representing rates in the graph.
Thanks for the question. And I hope this helps.
Bill
Attachments:
June 11, 2018 at 5:31 pm in reply to: Inconsistent graph behaviour when using parent-child tables #568Bill FinzerKeymasterHi Anna,
Thanks for the bug report!
I think this Help forum is a great place for feature requests ’cause then others can comment and/or +1 them.
Bill
Bill FinzerKeymasterHi Andee,
Thanks for posting this. You’re right that that message shouldn’t be there. I think it’s a holdover from the early days when CODAP had problems downloading to a local file in Safari. I’ll make sure that this is logged as a bug.
Bill
-
AuthorPosts