Forum Replies Created
-
AuthorPosts
-
 Bill FinzerKeymaster
Hey Rick!
Glad you found the answer to your question already present here in the forum.
Bill
Bill FinzerKeymasterHi Andee,
I was faced with this problem just a couple days ago. Unfortunately, the only thing I could do was set the unit to “million.” That worked fine for me, but it sounds like it won’t work well for you.
I’ll add it to our list of requested features.
Bill
Bill FinzerKeymasterHello Patrick,
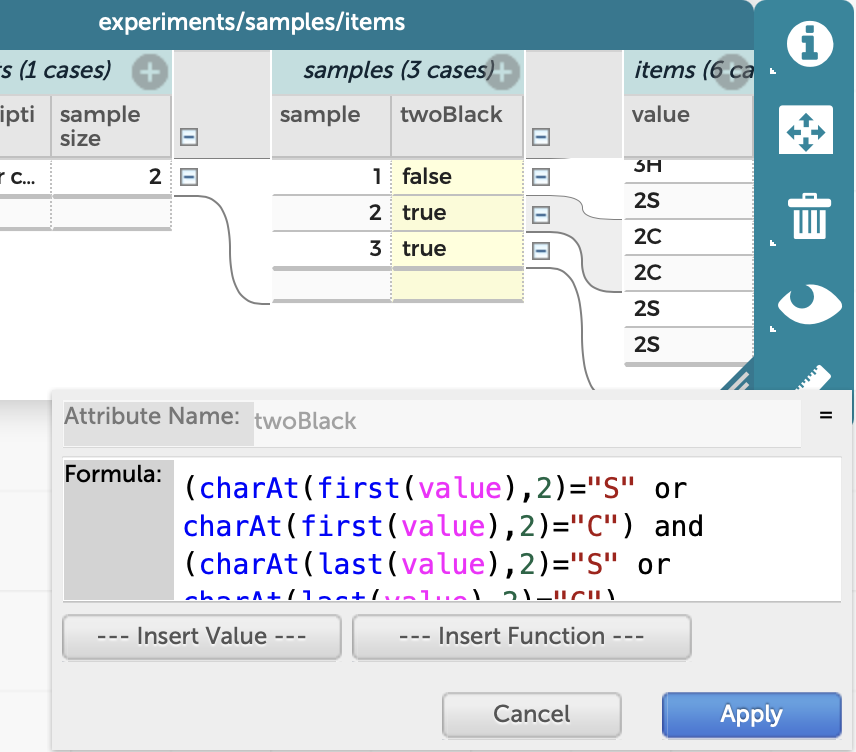
Assuming your cards are labeled like “5S” or “JD” this formula worked for me:
(charAt(first(value),2)=”S” or charAt(first(value),2)=”C”) and (charAt(last(value),2)=”S” or charAt(last(value),2)=”C”)
See the screenshot for the setup. Oh, and be sure to label the ten cards with a “T” rather than “10” since the latter will throw the indexing off.
Good luck!
Bill
Attachments:
Bill FinzerKeymasterHello Ashish,
Thanks for adding your request for this feature. It really helps us prioritize.
A question: Did you consider modifying the data structure as in my April 6 post? If you did so and rejected the idea, can you say a bit about what got in your way?
Thanks,
Bill
Bill FinzerKeymasterHi Andee,
Splendid bug! Many thanks!
Bill
Bill FinzerKeymasterHi Andee,
Yes, there is still such a plugin. You can find it here under the Utilities tab. It’s called Attribute Stacker. Supposing you already have a CODAP document with the dataset you wish to restructure, you can either the embeddable link into that document, or copy its URL and import it into that document.
The situation the Attribute Stacker deals with is one in which you have a bunch of attributes you want to stack into child cases.
I hope that’s your situation and that it works for you. It’s not particularly user-friendly, and that’s why we haven’t put it into the builtin plugins menu. (But we’re working to change that!)
Bill
Bill FinzerKeymasterHi Andee,
Definitely a bug. Thanks for reporting it. Dates give us a lot of trouble here in CODAP-land.
Bill
Bill FinzerKeymasterHi Andee,
Good question! I haven’t spent much time with the draw tool, so I had to create one to find out the answer. And the answer is “yes!”
Use the arrow tool to click on things you’ve drawn and they get selected as objects. (You can apparently even marquee select.) Once selected, press the delete key and they’re gone!
Bill
Bill FinzerKeymasterHi Susanne,
Unfortunately, it is not possible.
Bill
Bill FinzerKeymasterHello,
You’re right. Recent changes to the Sampler made it so the Duck Pond no longer produces the results desired. (The changes were deliberate.)
Here’s a workaround for now: After each time you press Start, edit the value of experiment to something other than “1;” for example “a.” Then when you press Start the new experiment will, once again, get the value of 1, which you could then edit to something else, perhaps “b.”
I’m going to check with the designers of the Duck Pond example document to see if they have a better idea.
Thanks very much for pointing this out!
Bill
Bill FinzerKeymasterHi Joachim,
Sorry to say, there isn’t any way other than to manually drag. I’ll add this to our feature request list thought.
Thanks reporting your wish for it.
Bill
Bill FinzerKeymasterHi Travis,
- Create a new attribute stateCode with the formula:
subString(full geo codes, 2, 2).
This extracts (as a number) the code for the state. - Import into your document a dataset that has each state and its code. Let’s say its name is states_with_codes and that it has attributes code and name.
- Back in the original dataset create a new attribute stateName with the formula:
lookupByKey(“states_with_codes”, “name”, “code”, stateCode) - You’ll probably want to Delete Formula (Keeping Values) for both of these new attributes you’ve created.
You can actually replace step 3 with a join move. Drag the code attribute from your imported dataset on top of stateCode and release. Voilá! You’ve joined the two datasets.
Hope this helps.
Bill
Bill FinzerKeymasterHere’s a fun example of time animation with a slider
Bill FinzerKeymasterHello Travis,
As in Desmos, CODAP’s sliders are used as parameters in formulas. Here are some specific use cases:
- In a scatter plot, it looks like the points fit nicely along some kind of curve. I plot a function in the scatter plot of the form y = x^k where k is the name I have given to a slider. Then I adjust the slider in an attempt to make the curve pass through the points. This is definitely simple enough that high school students can construct it.
- We have incidence of smallpox by year from 1900 to 1960 for 88 countries. We want to display the countries on a map colored by smallpox incident for a given year, which is given by a slider. At the country level, we construct an attribute that tells us the incidence for that country in the slider’s year. We color the map with that attribute. Then when we drag or animate the slider the map colors show us the evolution of the disease over the world and over time. Too hard for students to construct, but useful for them to interact with.
- Dan Damelin made a powerful model of climate change with upwards of eight sliders, each representing different factors. Adjusting these sliders allows the user to observe the effect of these factors. High school students with reasonable algebraic skills can construct such models, starting, of course, with a small number of slider parameters.
Perhaps others on this forum can suggest additional use cases?
Bill
Bill FinzerKeymasterHi Travis,
Choosy came about with a project that has some very large datasets; i.e. many attributes and many cases. Project staff wanted a tool that would help them create new documents that contain datasets with a subset of attributes and cases tailored for relatively specific classroom teaching contexts.
You have probably already surmised that Choosy is not useful for students, at least until they themselves are working with such large datasets. It’s meant for teachers and curriculum developers.
Often a Choosy user, after having trimmed a dataset down, will export that dataset and import it into a new document. That way all the unneeded data will have been left on the cutting room floor.
Hope that helps. Let us know if you find uses for Choosy yourself!
Bill
-
AuthorPosts