Forum Replies Created
-
AuthorPosts
-
December 15, 2022 at 3:27 pm in reply to: Problem with scale ranges for coloring points on a graph by numerical attribute #7335
 Jacob SagransParticipant
Thanks for the reply Bill. Maybe this could be changed/improved for CODAP at some point in the future? I should see if there is something about this in the CODAP Software Pivotal Tracker, and if not, add it.
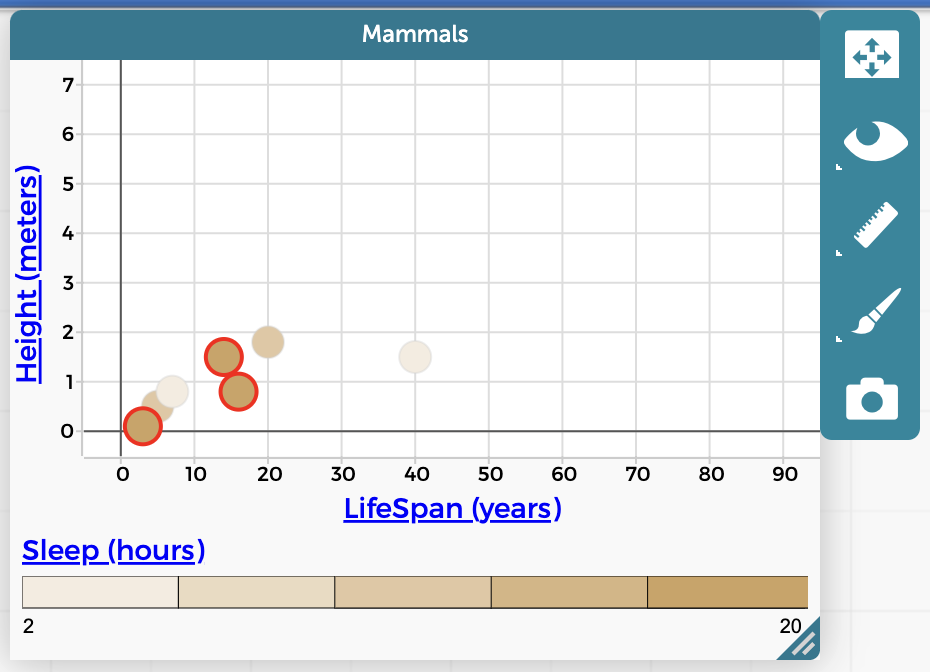
December 14, 2022 at 7:48 pm in reply to: Problem with scale ranges for coloring points on a graph by numerical attribute #7328Jacob SagransParticipantThis is what it looked like initially after I did the filtering. All the points shown are in the 10 to 12 bin (and are all highlighted if I click on that bin in the bar in the legend). But, as shown below, if I click on the 12 to 17 hour bin, points for 12 hours only are highlighted too.
December 14, 2022 at 7:46 pm in reply to: Problem with scale ranges for coloring points on a graph by numerical attribute #7327Jacob SagransParticipantOddly, if I open the link I shared now, the scale is redone and is only 10 to 12 hours, although there does still seem to be an issue of boundary values belonging to more than one bin.
Jacob SagransParticipantI’m revisiting this topic now because for a project I am working on I took a CODAP file a colleague created with Lyme disease data over the past 15 some years, added a map to it, and then created a slider to show change in Lyme rates from year to year (Bill, I am really indebted here to what you did for the smallpox over the years CODAP file). See the file I made here. I noticed that the minimum and maximum Lyme rate values of course change from year to year, which is a little confusing. I wonder if there might be some advantage to instead displaying something like simply 1, 2, 3, 4, 5 to represent the different quintiles on the color legend? Or I wonder if the quintiles could be set based on the full dataset and not the subset for each individual years (although there may be some cons to this if there is a lot of variation from year to year)? Just thinking/wondering aloud here, but I do think this issue becomes more complicated when instead of a static map there is a slider showing change over time.
September 16, 2021 at 2:42 pm in reply to: Hour of Data Activities: CODAP Story Builder vs Google Sites #6680Jacob SagransParticipantI love this idea Nick! I think now that Story Builder is a built in plugin available by default in CODAP that it would be great to use it for this. I don’t really have much else to add because I’m fairly new to using Story Builder, but I do want to follow the discussion here and see how your idea develops. Thanks, Jacob.
Jacob SagransParticipantThanks Bill. This is helpful to know. I will think some more about what we may want to do regarding screenshots/saved files/shared links with youth and program leaders.
Jacob SagransParticipantThanks Bill, I will check that out.
Jacob SagransParticipantThank you Bill! Okay, I am less worried now. I don’t think I would have noticed this except now for the first time in CODAP I am working with a data set with a fair amount of missing data.
Jacob SagransParticipantInteresting, if I add a case to the end of a table and leave all the attributes blank for that case, the calculation changes as if a zero value has been added. But then if I add another case and fill in at least some of the attributes, the missing data in the previous case is suddenly just ignored, not treated as zero.
To be sure, is there a way to type in something instead of zero or another number in a cell for an attribute to tell CODAP “do not use this case when making calculations involving this attribute”?
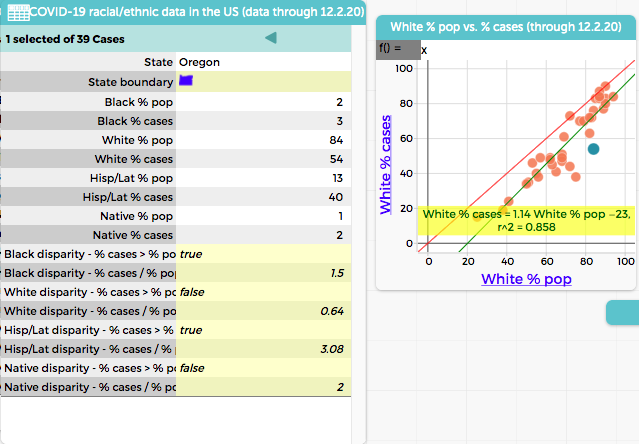
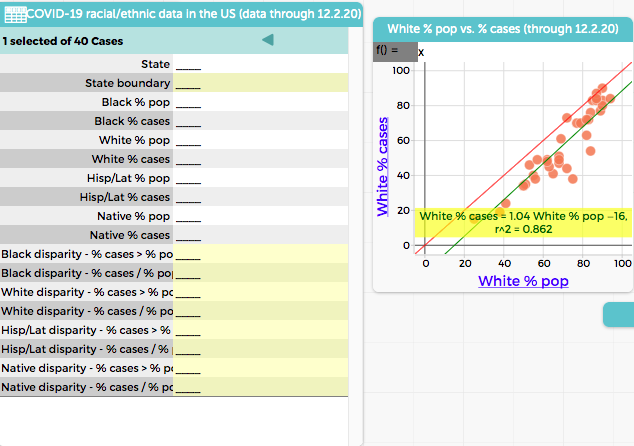
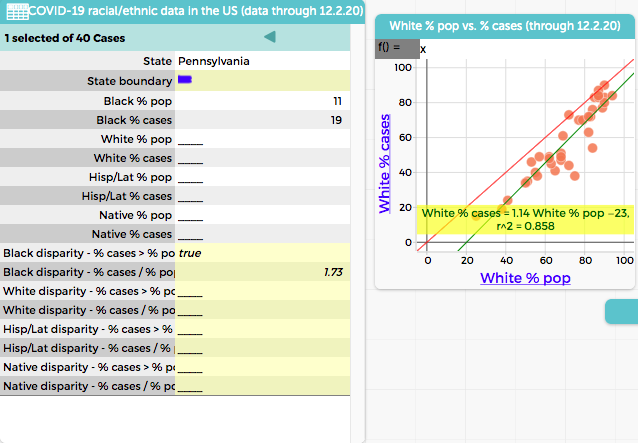
Jacob SagransParticipantI just noticed something odd related to this that is making me wonder how CODAP treats missing values. I found a situation where the missing value seems to be treated as zero for making a particular calculation, but at other times the missing value is ignored for making the calculation. Look at the following three images and note especially the change in the intercept for the least squares line on the graph. At first, when a new case is added, it seems the % population and % cases for white people are being treated as zero, as the intercept changes from -23 to -16. Then, I added in some data (but not the data for % population and % cases for white people) and the intercept goes back to -23. So in the second image, it seems the missing data is being treated as zero, whereas in the third image, the missing data seems like it is being ignored.
Attachments:
October 16, 2020 at 6:20 pm in reply to: Problems opening CODAP documents saved on Google Drive #5977Jacob SagransParticipantThanks, Bill!
October 15, 2020 at 4:27 pm in reply to: Problems opening CODAP documents saved on Google Drive #5970Jacob SagransParticipantThanks Bill. What’s odd is if I take the shared view link to the same document, save it as a new CODAP file in Drive, and then open it, it works fine–but not the original CODAP file.
October 15, 2020 at 2:44 pm in reply to: Problems opening CODAP documents saved on Google Drive #5968Jacob SagransParticipantI’m consistently having this “unable to open document” problem too when trying to access CODAP files I saved in google drive. Happens in multiple browsers. Happens even if I try what you suggested above. What’s going on?
Jacob SagransParticipantI just fixed it for myself. It seems although I was logged into my Google Drive and clicking on the CODAP file to open it, CODAP did not think I was logged into Google Drive. Thanks!
Jacob SagransParticipantI’ve had the exact same problem today with multiple CODAP files I’ve tried to open. Not sure what’s going on.
-
AuthorPosts